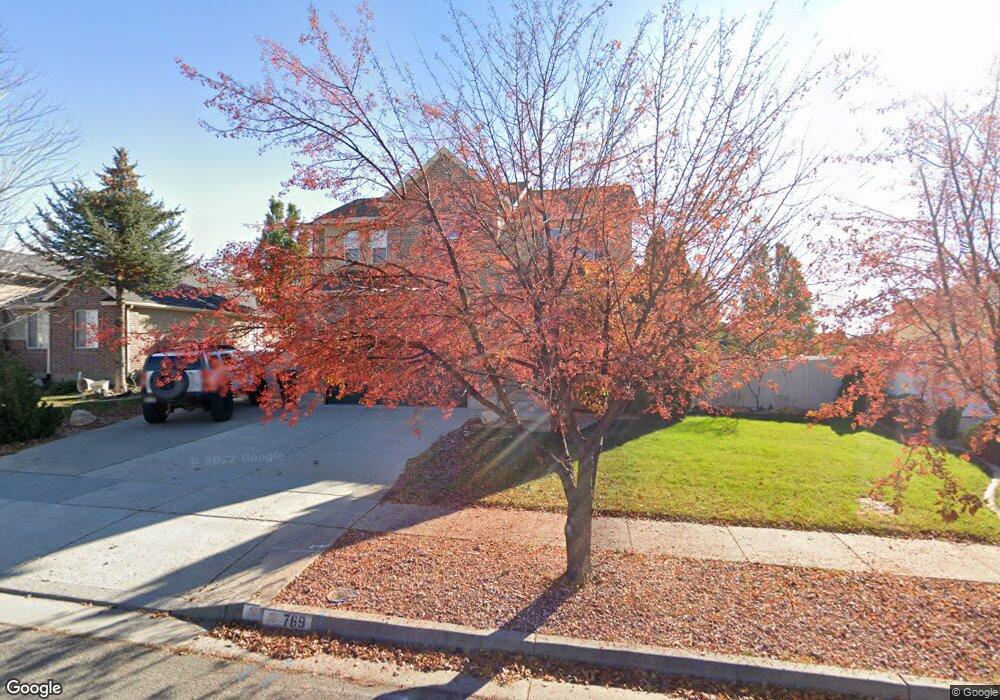
769 W 2010 S Syracuse, UT 84075
Estimated Value: $517,000 - $596,000
3
Beds
3
Baths
2,637
Sq Ft
$211/Sq Ft
Est. Value
About This Home
This home is located at 769 W 2010 S, Syracuse, UT 84075 and is currently estimated at $555,756, approximately $210 per square foot. 769 W 2010 S is a home located in Davis County with nearby schools including Bluff Ridge Elementary, Legacy Junior High School, and Clearfield High School.
Ownership History
Date
Name
Owned For
Owner Type
Purchase Details
Closed on
Dec 18, 2023
Sold by
Cleverly Tory Neil
Bought by
Cleverly Neil
Current Estimated Value
Home Financials for this Owner
Home Financials are based on the most recent Mortgage that was taken out on this home.
Original Mortgage
$495,853
Outstanding Balance
$487,527
Interest Rate
7.44%
Mortgage Type
FHA
Estimated Equity
$68,229
Purchase Details
Closed on
Jan 10, 2009
Sold by
Wailani Mulloy Terrilyn and Mulloy Patrick
Bought by
Cleverly Tory N and Cleverly Rachel J
Home Financials for this Owner
Home Financials are based on the most recent Mortgage that was taken out on this home.
Original Mortgage
$227,004
Interest Rate
5.97%
Mortgage Type
FHA
Purchase Details
Closed on
May 24, 2006
Sold by
Richmond American Homes Of Utah Inc
Bought by
Mulloy Patrick and Wailani Mulloy Terrilyn
Home Financials for this Owner
Home Financials are based on the most recent Mortgage that was taken out on this home.
Original Mortgage
$237,672
Interest Rate
6.46%
Mortgage Type
VA
Create a Home Valuation Report for This Property
The Home Valuation Report is an in-depth analysis detailing your home's value as well as a comparison with similar homes in the area
Home Values in the Area
Average Home Value in this Area
Purchase History
| Date | Buyer | Sale Price | Title Company |
|---|---|---|---|
| Cleverly Neil | -- | Stewart Title | |
| Cleverly Tory N | -- | Utah Commercial Title Co | |
| Mulloy Patrick | -- | First American Title |
Source: Public Records
Mortgage History
| Date | Status | Borrower | Loan Amount |
|---|---|---|---|
| Open | Cleverly Neil | $495,853 | |
| Previous Owner | Cleverly Tory N | $227,004 | |
| Previous Owner | Mulloy Patrick | $237,672 |
Source: Public Records
Tax History Compared to Growth
Tax History
| Year | Tax Paid | Tax Assessment Tax Assessment Total Assessment is a certain percentage of the fair market value that is determined by local assessors to be the total taxable value of land and additions on the property. | Land | Improvement |
|---|---|---|---|---|
| 2025 | $2,947 | $284,350 | $119,915 | $164,435 |
| 2024 | $2,791 | $271,150 | $94,583 | $176,567 |
| 2023 | $2,616 | $463,000 | $132,047 | $330,953 |
| 2022 | $2,834 | $275,001 | $76,632 | $198,369 |
| 2021 | $2,483 | $373,000 | $112,730 | $260,270 |
| 2020 | $2,256 | $328,000 | $100,492 | $227,508 |
| 2019 | $2,236 | $321,000 | $95,433 | $225,567 |
| 2018 | $2,042 | $291,000 | $93,659 | $197,341 |
| 2016 | $1,763 | $131,725 | $36,051 | $95,674 |
| 2015 | $1,826 | $129,965 | $36,051 | $93,914 |
| 2014 | $1,830 | $132,760 | $36,051 | $96,709 |
| 2013 | -- | $124,810 | $32,907 | $91,903 |
Source: Public Records
Map
Nearby Homes