769 Weetamoe St Fall River, MA 02720
Highlands-Fall River NeighborhoodEstimated Value: $441,000 - $492,000
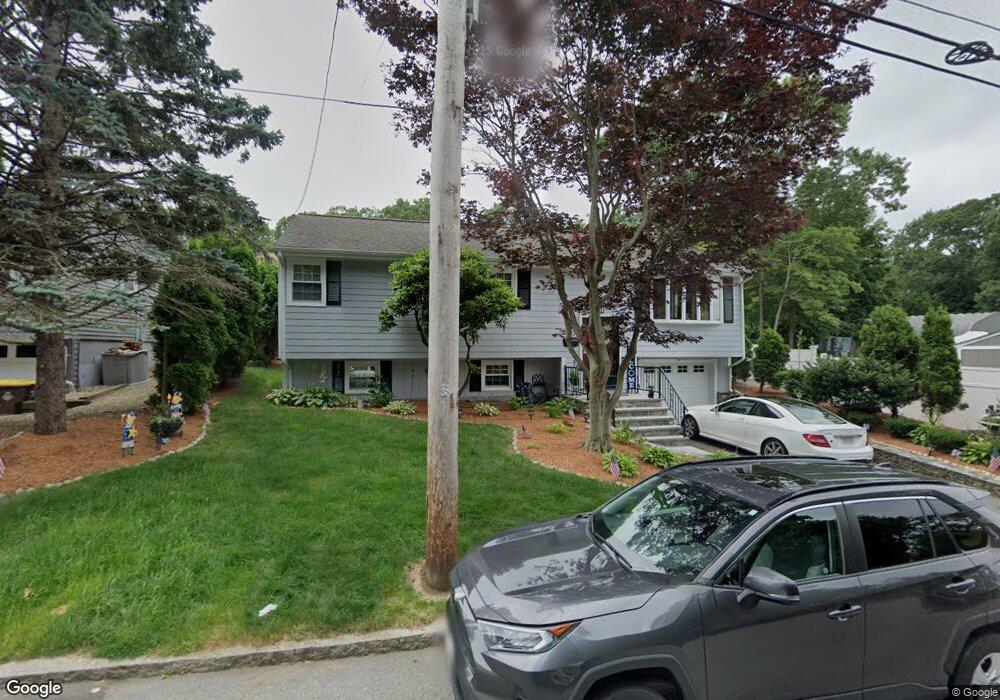
About This Home
This home is located at 769 Weetamoe St, Fall River, MA 02720 and is currently estimated at $458,196, approximately $250 per square foot. 769 Weetamoe St is a home located in Bristol County with nearby schools including James Tansey Elementary School, Morton Middle School, and B M C Durfee High School.
Ownership History
We collect this data history from publicly available records. To have your information removed, we recommend requesting removal directly through your county’s website.
Purchase Details
Home Values in the Area
Average Home Value in this Area
Purchase History
We collect this data history from publicly available records. To have your information removed, we recommend requesting removal directly through your county’s website.
| Date | Buyer | Sale Price | Title Company |
|---|---|---|---|
| $120,000 | -- |
Mortgage History
We collect this data history from publicly available records. To have your information removed, we recommend requesting removal directly through your county’s website.
| Date | Status | Borrower | Loan Amount |
|---|---|---|---|
| Closed | $50,000 | ||
| Closed | $40,000 | ||
| Closed | $88,500 | ||
| Closed | $16,000 | ||
| Closed | $92,200 |
Tax History
We collect this data history from publicly available records. To have your information removed, we recommend requesting removal directly through your county’s website.
| Year | Tax Paid | Tax Assessment Tax Assessment Total Assessment is a certain percentage of the fair market value that is determined by local assessors to be the total taxable value of land and additions on the property. | Land | Improvement |
|---|---|---|---|---|
| 2025 | $3,649 | $318,700 | $132,100 | $186,600 |
| 2024 | $3,353 | $291,800 | $127,000 | $164,800 |
| 2023 | $3,074 | $250,500 | $114,000 | $136,500 |
| 2022 | $2,798 | $221,700 | $105,500 | $116,200 |
| 2021 | $2,878 | $208,100 | $99,700 | $108,400 |
| 2020 | $2,860 | $197,900 | $95,900 | $102,000 |
| 2019 | $2,885 | $197,900 | $95,900 | $102,000 |
| 2018 | $2,766 | $189,200 | $95,300 | $93,900 |
| 2017 | $2,601 | $185,800 | $95,300 | $90,500 |
| 2016 | $2,384 | $174,900 | $95,300 | $79,600 |
| 2015 | $2,324 | $177,700 | $95,300 | $82,400 |
| 2014 | $2,235 | $177,700 | $95,300 | $82,400 |
Map
- 79 Woodlawn St
- 1244 President Ave
- 1231 Robeson St
- 554 Madison St
- 301 Madison St
- 435 Stetson St Unit 437
- 435-437 Stetson St
- 152 Harding St
- 333 Langley St
- 65-67 Farnham St
- 878 Highland Ave
- 12 Goddard St
- 707 Highland Ave
- 45 Read St
- 1800 Robeson St
- 604 Woodlawn St
- 131 Stewart St Unit 3B
- 414 Archer St
- 45 Archer St
- 87 Stowe St
Ask me questions while you tour the home.