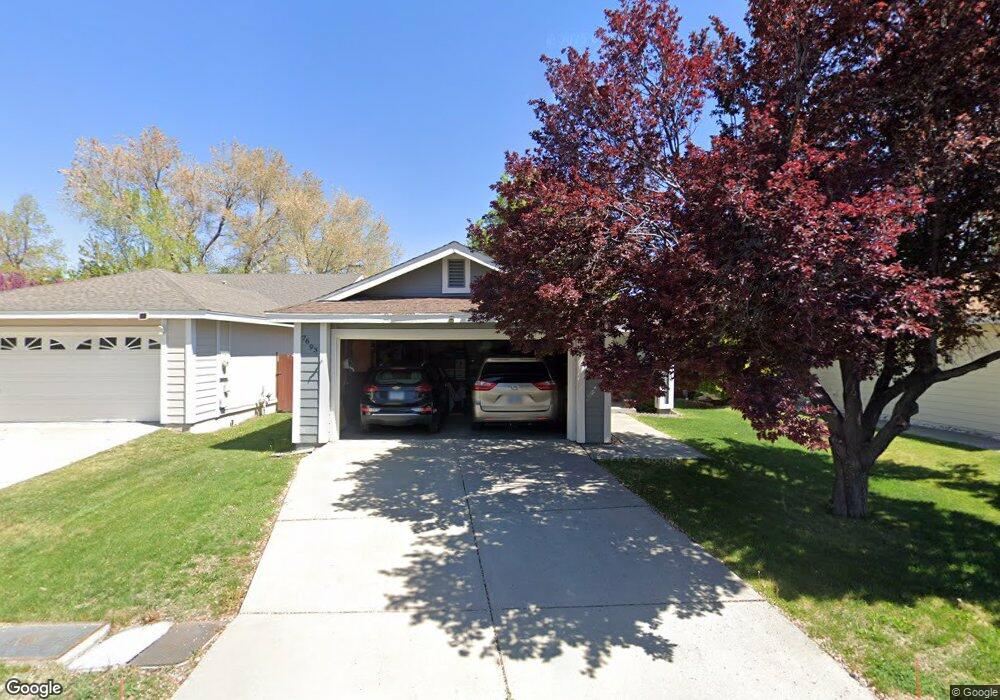
7693 Water View Way Reno, NV 89511
Bartley Ranch NeighborhoodEstimated Value: $355,164 - $471,000
2
Beds
2
Baths
833
Sq Ft
$503/Sq Ft
Est. Value
About This Home
This home is located at 7693 Water View Way, Reno, NV 89511 and is currently estimated at $419,041, approximately $503 per square foot. 7693 Water View Way is a home located in Washoe County with nearby schools including Huffaker Elementary School, Edward L Pine Middle School, and Reno High School.
Ownership History
Date
Name
Owned For
Owner Type
Purchase Details
Closed on
Mar 6, 2003
Sold by
Gable Cecelia A
Bought by
Alder Clay
Current Estimated Value
Home Financials for this Owner
Home Financials are based on the most recent Mortgage that was taken out on this home.
Original Mortgage
$118,400
Interest Rate
5.82%
Mortgage Type
Purchase Money Mortgage
Purchase Details
Closed on
Sep 12, 2002
Sold by
Miner Bobby V
Bought by
Marquez Susan A
Purchase Details
Closed on
Jun 19, 1999
Sold by
Tanis Bruce
Bought by
Miner Bobby V and Marquez Daniel R
Purchase Details
Closed on
Oct 4, 1997
Sold by
Tanis Ruth and Tanis Bruce
Bought by
Tanis Ruth Thom and Tanis Bruce
Purchase Details
Closed on
May 20, 1994
Sold by
Dale Poe Development Corp
Bought by
Tanis Ruth and Tanis Bruce
Home Financials for this Owner
Home Financials are based on the most recent Mortgage that was taken out on this home.
Original Mortgage
$77,400
Interest Rate
6.5%
Create a Home Valuation Report for This Property
The Home Valuation Report is an in-depth analysis detailing your home's value as well as a comparison with similar homes in the area
Home Values in the Area
Average Home Value in this Area
Purchase History
| Date | Buyer | Sale Price | Title Company |
|---|---|---|---|
| Alder Clay | -- | Stewart Title Of Northern Nv | |
| Alder Clay | $148,000 | Stewart Title Of Northern Nv | |
| Marquez Susan A | -- | -- | |
| Miner Bobby V | $59,500 | First American Title Co | |
| Miner Bobby V | $59,500 | First American Title Co | |
| Tanis Ruth Thom | -- | -- | |
| Tanis Ruth | $86,000 | Comstock Title Company |
Source: Public Records
Mortgage History
| Date | Status | Borrower | Loan Amount |
|---|---|---|---|
| Closed | Alder Clay | $118,400 | |
| Previous Owner | Tanis Ruth | $77,400 |
Source: Public Records
Tax History Compared to Growth
Tax History
| Year | Tax Paid | Tax Assessment Tax Assessment Total Assessment is a certain percentage of the fair market value that is determined by local assessors to be the total taxable value of land and additions on the property. | Land | Improvement |
|---|---|---|---|---|
| 2025 | $1,913 | $69,291 | $36,855 | $32,436 |
| 2024 | $1,913 | $68,993 | $36,120 | $32,873 |
| 2023 | $1,773 | $66,863 | $35,700 | $31,163 |
| 2022 | $1,644 | $56,154 | $29,995 | $26,159 |
| 2021 | $1,522 | $49,772 | $23,625 | $26,147 |
| 2020 | $1,430 | $47,522 | $21,210 | $26,312 |
| 2019 | $1,364 | $46,040 | $20,545 | $25,495 |
| 2018 | $1,298 | $39,548 | $14,455 | $25,093 |
| 2017 | $1,249 | $39,691 | $14,455 | $25,236 |
| 2016 | $1,216 | $38,273 | $12,460 | $25,813 |
| 2015 | $313 | $36,313 | $10,780 | $25,533 |
| 2014 | $1,167 | $33,785 | $8,750 | $25,035 |
| 2013 | -- | $30,538 | $6,510 | $24,028 |
Source: Public Records
Map
Nearby Homes
- 7554 Whimbleton Way Unit 6
- 831 Blue Falls Place
- 7187 Blue Falls Cir
- 1145 Country Estates Cir
- 8620 Dixon Ln
- 555 E Patriot Blvd Unit 276
- 555 E Patriot Blvd Unit M262
- 555 E Patriot Blvd Unit 218
- 555 E Patriot Blvd Unit 170
- 6421 Bonde Farms Ln
- 8820 Dixon Ln
- 8999 Panorama Dr
- 530 E Patriot Blvd Unit B114
- 450 Len Cir
- 84 Caballada St Unit 15-1
- 83 Caballada St Unit 14-1
- 81 Caballada St
- 1865 Olive Ln
- 46 Campolina St Unit 22-1
- 66 Caballada St
- 7687 Water View Way
- 7681 Water View Way Unit 3
- 7641 Devonshire Ln
- 7675 Water View Way
- 7635 Devonshire Ln Unit 3
- 7698 Water View Way Unit 4
- 7647 Devonshire Ln
- 7692 Water View Way
- 7629 Devonshire Ln
- 7671 Barnsdale Rd
- 7653 Devonshire Ln
- 7524 Wheeldale Cir Unit 5
- 7536 Wheeldale Cir
- 7530 Wheeldale Cir
- 7661 Water View Way
- 7677 Barnsdale Rd
- 7623 Devonshire Ln Unit 3
- 7665 Water View Way
- 7518 Wheeldale Cir
- 7542 Wheeldale Cir Unit 5