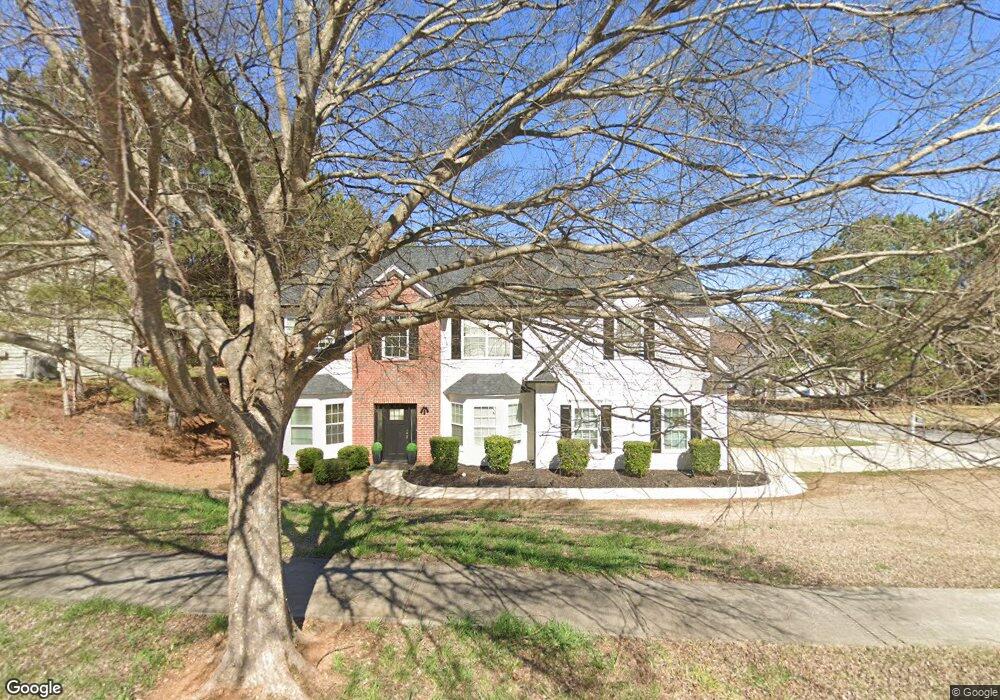
7695 Overlook Bend Fairburn, GA 30213
Estimated Value: $333,000 - $361,199
4
Beds
3
Baths
3,310
Sq Ft
$105/Sq Ft
Est. Value
About This Home
This home is located at 7695 Overlook Bend, Fairburn, GA 30213 and is currently estimated at $348,800, approximately $105 per square foot. 7695 Overlook Bend is a home located in Fulton County with nearby schools including Renaissance Elementary School, Renaissance Middle School, and Langston Hughes High School.
Ownership History
Date
Name
Owned For
Owner Type
Purchase Details
Closed on
Aug 27, 2010
Sold by
Gsamp Trust 2005 & He3
Bought by
Brooks Marcel L and Brooks Sheri L
Current Estimated Value
Home Financials for this Owner
Home Financials are based on the most recent Mortgage that was taken out on this home.
Original Mortgage
$92,000
Outstanding Balance
$61,211
Interest Rate
4.59%
Mortgage Type
New Conventional
Estimated Equity
$287,589
Purchase Details
Closed on
Nov 3, 2009
Sold by
Partridge Jerome
Bought by
Gsamp Trust 2005 & He3
Purchase Details
Closed on
Feb 28, 2005
Sold by
Sharon Mcswain Hms Inc
Bought by
Partridge Jerome
Home Financials for this Owner
Home Financials are based on the most recent Mortgage that was taken out on this home.
Original Mortgage
$194,400
Interest Rate
9.75%
Mortgage Type
New Conventional
Create a Home Valuation Report for This Property
The Home Valuation Report is an in-depth analysis detailing your home's value as well as a comparison with similar homes in the area
Home Values in the Area
Average Home Value in this Area
Purchase History
| Date | Buyer | Sale Price | Title Company |
|---|---|---|---|
| Brooks Marcel L | $115,000 | -- | |
| Gsamp Trust 2005 & He3 | $119,025 | -- | |
| Partridge Jerome | $194,500 | -- |
Source: Public Records
Mortgage History
| Date | Status | Borrower | Loan Amount |
|---|---|---|---|
| Open | Brooks Marcel L | $92,000 | |
| Previous Owner | Partridge Jerome | $194,400 |
Source: Public Records
Tax History
| Year | Tax Paid | Tax Assessment Tax Assessment Total Assessment is a certain percentage of the fair market value that is determined by local assessors to be the total taxable value of land and additions on the property. | Land | Improvement |
|---|---|---|---|---|
| 2025 | $863 | $136,240 | $34,840 | $101,400 |
| 2023 | $4,294 | $152,120 | $29,720 | $122,400 |
| 2022 | $1,521 | $100,280 | $15,600 | $84,680 |
| 2021 | $1,485 | $88,480 | $13,640 | $74,840 |
| 2020 | $1,481 | $87,440 | $13,480 | $73,960 |
| 2019 | $1,798 | $85,920 | $13,240 | $72,680 |
| 2018 | $2,051 | $75,280 | $11,240 | $64,040 |
| 2017 | $1,369 | $51,560 | $9,720 | $41,840 |
| 2016 | $1,336 | $51,560 | $9,720 | $41,840 |
| 2015 | $1,339 | $51,560 | $9,720 | $41,840 |
| 2014 | $1,364 | $51,560 | $9,720 | $41,840 |
Source: Public Records
Map
Nearby Homes
- 7899 Village Pass
- 7789 Village Pass
- 5745 Village Loop
- 5334 Tolar Rd
- 5372 Tolar Rd Unit 78
- 5364 Tolar Rd Unit 74
- 5372 Rd
- 5371 Rd
- 545 Tuscan Cove
- 5366 Rd
- 5363 Tolar Lot 49 Rd
- 5359 Tolar Lot 51 Rd
- 5352 Tolar Rd Unit 68
- 5430 Bethlehem Rd
- 5346 Tolar Lot 65 Rd
- 7308 Tolar Rd Unit 40
- 5371 Tolar Rd Unit LOT 45
- 5365 Tolar Rd Unit LOT 48
- 5363 Tolar Rd Unit LOT 49
- 5357 Tolar Rd Unit 52
- 7694 Overlook Bend
- 7699 Overlook Bend
- 7701 Overlook Bend
- 7691 Overlook Bend Unit 350
- 7691 Overlook Bend
- 7982 Overlook Bend
- 7698 Overlook Bend
- 7656 Babbling View
- 7660 Village Loop
- 7660 Village Loop Unit 333
- 7696 Overlook Bend
- 7687 Overlook Bend
- 5466 Babbling View
- 7648 Cozy Ln
- 7685 Overlook Bend
- 7688 Overlook Bend
- 5467 Babbling View
- 7686 Overlook Bend
- 5821 Village Loop
- 5823 Village Loop
Your Personal Tour Guide
Ask me questions while you tour the home.