77 6th Ave Pocasset, MA 02559
Hyannis NeighborhoodEstimated Value: $619,000 - $829,453
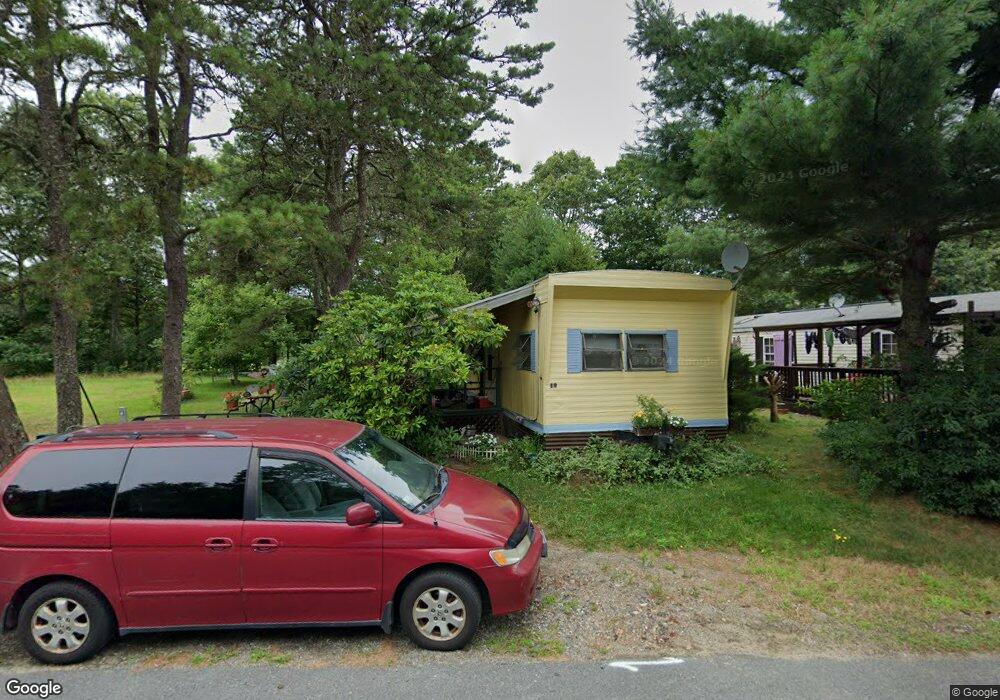
About This Home
This home is located at 77 6th Ave, Pocasset, MA 02559 and is currently estimated at $765,613, approximately $546 per square foot. 77 6th Ave is a home located in Barnstable County with nearby schools including Hyannis West Elementary School, Barnstable United Elementary School, and Barnstable Intermediate School.
Ownership History
We collect this data history from publicly available records. To have your information removed, we recommend requesting removal directly through your county’s website.
Purchase Details
Purchase Details
Purchase Details
Home Financials for this Owner
Home Financials are based on the most recent Mortgage that was taken out on this home.Home Values in the Area
Average Home Value in this Area
Purchase History
We collect this data history from publicly available records. To have your information removed, we recommend requesting removal directly through your county’s website.
| Date | Buyer | Sale Price | Title Company |
|---|---|---|---|
| -- | None Available | ||
| $399,000 | -- | ||
| $359,000 | -- |
Mortgage History
We collect this data history from publicly available records. To have your information removed, we recommend requesting removal directly through your county’s website.
| Date | Status | Borrower | Loan Amount |
|---|---|---|---|
| Previous Owner | $287,200 |
Tax History
We collect this data history from publicly available records. To have your information removed, we recommend requesting removal directly through your county’s website.
| Year | Tax Paid | Tax Assessment Tax Assessment Total Assessment is a certain percentage of the fair market value that is determined by local assessors to be the total taxable value of land and additions on the property. | Land | Improvement |
|---|---|---|---|---|
| 2025 | $6,554 | $707,000 | $309,700 | $397,300 |
| 2024 | $6,497 | $717,900 | $309,700 | $408,200 |
| 2023 | $6,111 | $638,600 | $287,900 | $350,700 |
| 2022 | $5,689 | $491,700 | $199,100 | $292,600 |
| 2021 | $5,631 | $472,800 | $218,000 | $254,800 |
| 2020 | $5,614 | $455,300 | $218,000 | $237,300 |
| 2019 | $5,422 | $431,000 | $227,500 | $203,500 |
| 2018 | $4,910 | $399,200 | $229,500 | $169,700 |
| 2017 | $4,724 | $394,000 | $229,500 | $164,500 |
| 2016 | $4,997 | $426,000 | $240,400 | $185,600 |
| 2015 | $4,408 | $381,000 | $225,100 | $155,900 |
Map
- 558 Craigville Beach Rd Unit 7
- 200 6th Ave
- 142 Greely Ave
- 244 Craigville Beach Rd
- 780 Craigville Beach Rd Unit 1
- 780 Craigville Beach Rd Unit D-2
- 54 Melbourne Rd
- 109 Harbor Hills Rd
- 22 Southwinds Cir
- 181 Elliott Rd
- 498 Elliott Rd
- 443 Elliott Rd
- 61 Linda Ln
- 35 Grayton Ave
- 14 Marston Ave
- 45 Marston Ave
- 307 W Main St Unit 1
- 12 Frost Ln
- 64 Pitchers Way
- 46 Washington Ave
Ask me questions while you tour the home.