77 9th St Providence, RI 02906
Hope NeighborhoodEstimated Value: $454,000 - $891,000
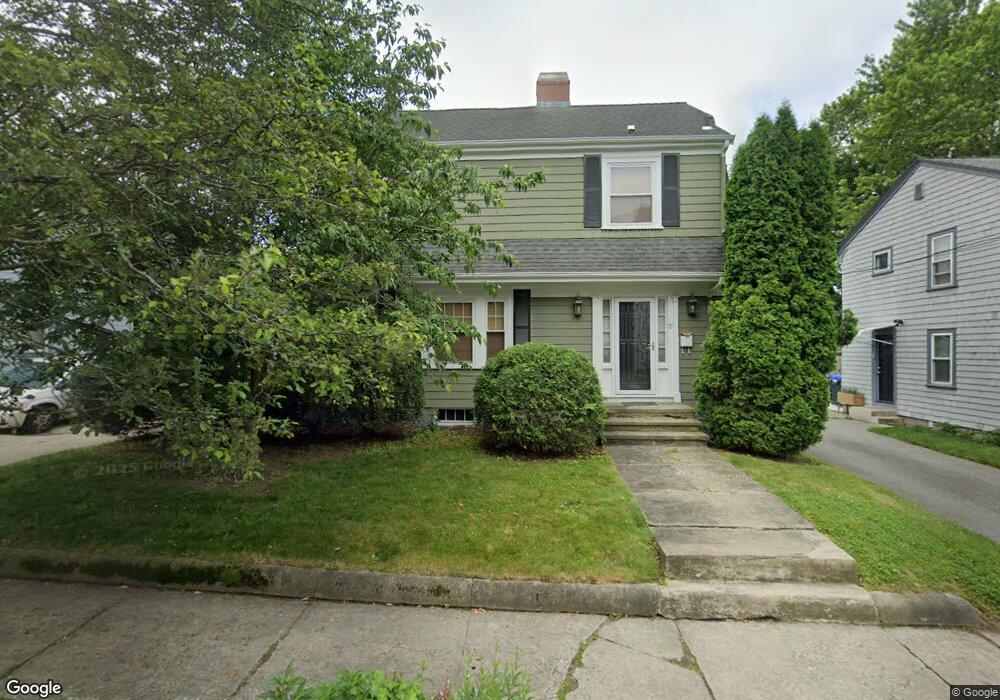
About This Home
This home is located at 77 9th St, Providence, RI 02906 and is currently estimated at $651,099, approximately $452 per square foot. 77 9th St is a home located in Providence County with nearby schools including International Charter School, Blackstone Academy Charter School, and Jewish Community Day School Of Rhode Island.
Ownership History
We collect this data history from publicly available records. To have your information removed, we recommend requesting removal directly through your county’s website.
Purchase Details
Purchase Details
Home Values in the Area
Average Home Value in this Area
Purchase History
We collect this data history from publicly available records. To have your information removed, we recommend requesting removal directly through your county’s website.
| Date | Buyer | Sale Price | Title Company |
|---|---|---|---|
| $280,000 | -- | ||
| $129,000 | -- |
Mortgage History
We collect this data history from publicly available records. To have your information removed, we recommend requesting removal directly through your county’s website.
| Date | Status | Borrower | Loan Amount |
|---|---|---|---|
| Open | $230,000 | ||
| Closed | $38,000 | ||
| Closed | $45,000 |
Tax History
We collect this data history from publicly available records. To have your information removed, we recommend requesting removal directly through your county’s website.
| Year | Tax Paid | Tax Assessment Tax Assessment Total Assessment is a certain percentage of the fair market value that is determined by local assessors to be the total taxable value of land and additions on the property. | Land | Improvement |
|---|---|---|---|---|
| 2025 | $5,104 | $607,600 | $372,600 | $235,000 |
| 2024 | $8,790 | $479,000 | $251,100 | $227,900 |
| 2023 | $8,790 | $479,000 | $251,100 | $227,900 |
| 2022 | $8,526 | $479,000 | $251,100 | $227,900 |
| 2021 | $9,004 | $366,600 | $202,700 | $163,900 |
| 2020 | $9,004 | $366,600 | $202,700 | $163,900 |
| 2019 | $9,004 | $366,600 | $202,700 | $163,900 |
| 2018 | $10,182 | $318,600 | $175,500 | $143,100 |
| 2017 | $10,182 | $318,600 | $175,500 | $143,100 |
| 2016 | $10,182 | $318,600 | $175,500 | $143,100 |
| 2015 | $9,490 | $286,700 | $163,800 | $122,900 |
| 2014 | $9,676 | $286,700 | $163,800 | $122,900 |
| 2013 | $9,676 | $286,700 | $163,800 | $122,900 |
Map
- 275 Highland Ave
- 68 9th St
- 57 9th St
- 59 10th St
- 59 10th St Unit 2
- 72 9th St Unit 74
- 72 9th St Unit 74
- 72 9th St Unit 74
- 72 9th St Unit 2
- 72 9th St Unit 1
- 61 10th St Unit 2
- 69 9th St
- 257 Highland Ave Unit 259
- 257 Highland Ave Unit 1
- 257 Highland Ave
- 257 Highland Ave Unit 2
- 257 Highland Ave Unit 3
- 46 9th St
- 69 10th St
- 78 9th St
Ask me questions while you tour the home.