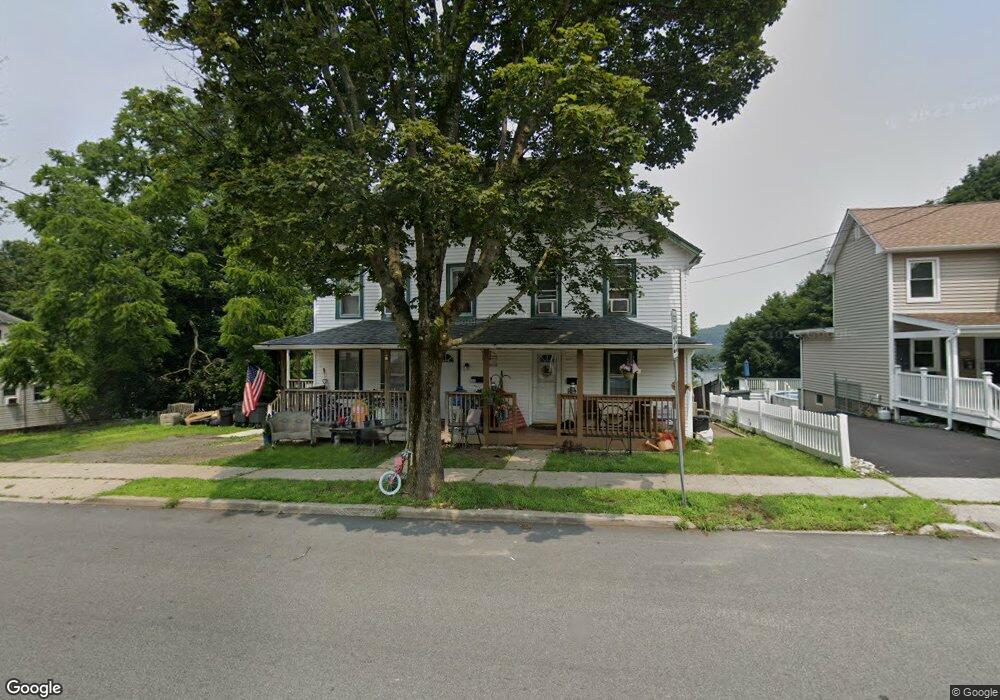
77 Allen St Unit 79 Netcong, NJ 07857
Estimated Value: $440,792 - $536,000
--
Bed
--
Bath
1,512
Sq Ft
$315/Sq Ft
Est. Value
About This Home
This home is located at 77 Allen St Unit 79, Netcong, NJ 07857 and is currently estimated at $475,948, approximately $314 per square foot. 77 Allen St Unit 79 is a home located in Morris County with nearby schools including Netcong Elementary School and Lenape Val Regional High School.
Ownership History
Date
Name
Owned For
Owner Type
Purchase Details
Closed on
Jan 30, 2019
Sold by
Zanghi Nicholas and Kopec-Zanghi Jeanine
Bought by
Adames Carlos and Adames Stephanie
Current Estimated Value
Home Financials for this Owner
Home Financials are based on the most recent Mortgage that was taken out on this home.
Original Mortgage
$266,000
Outstanding Balance
$234,334
Interest Rate
4.6%
Mortgage Type
New Conventional
Estimated Equity
$241,614
Purchase Details
Closed on
Feb 5, 2003
Sold by
Salas Fortunata
Bought by
Zanghi Nicholas and Kopec Jeanine
Home Financials for this Owner
Home Financials are based on the most recent Mortgage that was taken out on this home.
Original Mortgage
$272,444
Interest Rate
5.95%
Mortgage Type
FHA
Create a Home Valuation Report for This Property
The Home Valuation Report is an in-depth analysis detailing your home's value as well as a comparison with similar homes in the area
Home Values in the Area
Average Home Value in this Area
Purchase History
| Date | Buyer | Sale Price | Title Company |
|---|---|---|---|
| Adames Carlos | $280,000 | Multiple | |
| Zanghi Nicholas | $247,000 | -- |
Source: Public Records
Mortgage History
| Date | Status | Borrower | Loan Amount |
|---|---|---|---|
| Open | Adames Carlos | $266,000 | |
| Previous Owner | Zanghi Nicholas | $272,444 |
Source: Public Records
Tax History Compared to Growth
Tax History
| Year | Tax Paid | Tax Assessment Tax Assessment Total Assessment is a certain percentage of the fair market value that is determined by local assessors to be the total taxable value of land and additions on the property. | Land | Improvement |
|---|---|---|---|---|
| 2025 | $9,486 | $277,600 | $109,300 | $168,300 |
| 2024 | $9,569 | $277,600 | $109,300 | $168,300 |
| 2023 | $9,569 | $277,600 | $109,300 | $168,300 |
| 2022 | $8,669 | $277,600 | $109,300 | $168,300 |
| 2021 | $8,669 | $277,600 | $109,300 | $168,300 |
| 2020 | $11,852 | $385,300 | $183,500 | $201,800 |
| 2019 | $11,282 | $385,300 | $183,500 | $201,800 |
| 2018 | $10,607 | $385,300 | $183,500 | $201,800 |
| 2017 | $10,191 | $385,300 | $183,500 | $201,800 |
| 2016 | $9,914 | $385,300 | $183,500 | $201,800 |
| 2015 | $9,552 | $385,300 | $183,500 | $201,800 |
| 2014 | $9,135 | $385,300 | $183,500 | $201,800 |
Source: Public Records
Map
Nearby Homes