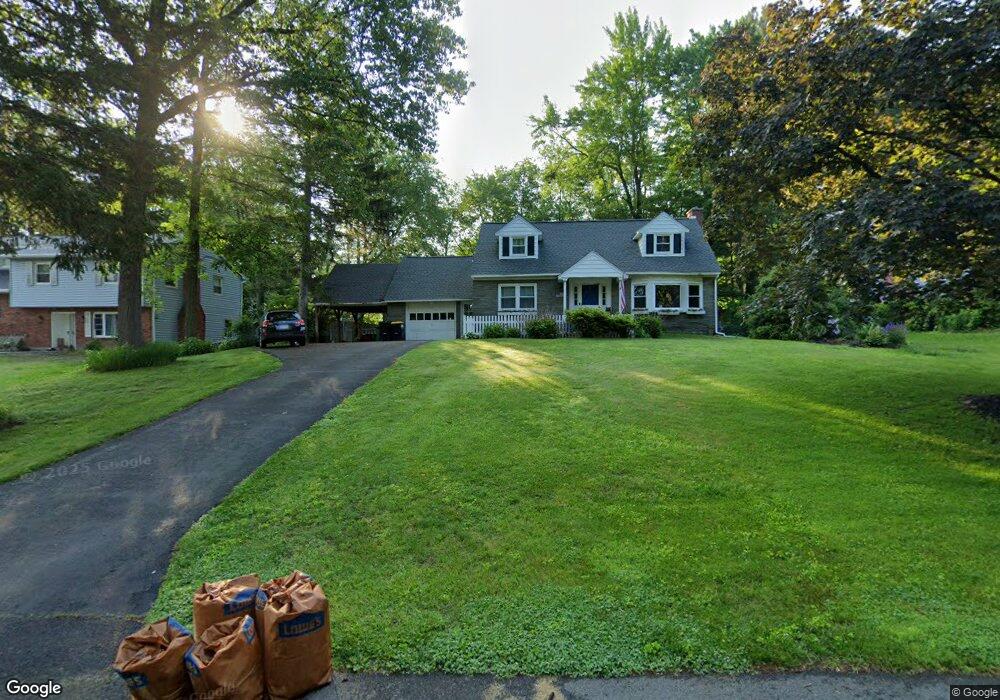
77 Ashtree Ln Schenectady, NY 12309
Estimated Value: $319,000 - $432,000
3
Beds
3
Baths
1,909
Sq Ft
$204/Sq Ft
Est. Value
About This Home
This home is located at 77 Ashtree Ln, Schenectady, NY 12309 and is currently estimated at $390,327, approximately $204 per square foot. 77 Ashtree Ln is a home located in Albany County with nearby schools including Birchwood Elementary School, Iroquois Middle School, and Van Antwerp Middle School.
Ownership History
Date
Name
Owned For
Owner Type
Purchase Details
Closed on
Dec 1, 2021
Sold by
Perlee David L
Bought by
Perlee David L and Perlee Deana T
Current Estimated Value
Home Financials for this Owner
Home Financials are based on the most recent Mortgage that was taken out on this home.
Original Mortgage
$203,200
Outstanding Balance
$154,967
Interest Rate
3.14%
Mortgage Type
New Conventional
Estimated Equity
$235,360
Purchase Details
Closed on
Dec 30, 2009
Sold by
Perlee Kathleen Beth
Bought by
Perlee David L
Purchase Details
Closed on
Mar 17, 2000
Sold by
John F Jo-An Burns
Bought by
Perlee David L
Purchase Details
Closed on
Jul 28, 1994
Sold by
Gates Florence E
Bought by
Buros John F and Buros Jo-An
Create a Home Valuation Report for This Property
The Home Valuation Report is an in-depth analysis detailing your home's value as well as a comparison with similar homes in the area
Home Values in the Area
Average Home Value in this Area
Purchase History
| Date | Buyer | Sale Price | Title Company |
|---|---|---|---|
| Perlee David L | -- | None Listed On Document | |
| Perlee David L | -- | None Available | |
| Perlee David L | $146,000 | Gerald S Chapman | |
| Buros John F | $145,000 | -- |
Source: Public Records
Mortgage History
| Date | Status | Borrower | Loan Amount |
|---|---|---|---|
| Open | Perlee David L | $203,200 |
Source: Public Records
Tax History
| Year | Tax Paid | Tax Assessment Tax Assessment Total Assessment is a certain percentage of the fair market value that is determined by local assessors to be the total taxable value of land and additions on the property. | Land | Improvement |
|---|---|---|---|---|
| 2025 | $7,624 | $130,000 | $32,500 | $97,500 |
| 2024 | $7,624 | $130,000 | $32,500 | $97,500 |
| 2023 | $7,304 | $130,000 | $32,500 | $97,500 |
| 2022 | $7,670 | $130,000 | $32,500 | $97,500 |
| 2021 | $7,639 | $130,000 | $32,500 | $97,500 |
| 2020 | $5,481 | $130,000 | $32,500 | $97,500 |
| 2019 | $3,149 | $130,000 | $32,500 | $97,500 |
| 2018 | $5,168 | $130,000 | $32,500 | $97,500 |
| 2017 | $0 | $130,000 | $32,500 | $97,500 |
| 2016 | $4,797 | $130,000 | $32,500 | $97,500 |
| 2015 | -- | $130,000 | $32,500 | $97,500 |
| 2014 | -- | $130,000 | $32,500 | $97,500 |
Source: Public Records
Map
Nearby Homes
- 73 Ashtree Ln
- 4 Oaktree Ln
- 2965 Hillcrest Rd
- 388 Vly Rd
- 605 Vly Pointe Dr
- 607 Vly Pointe Dr
- 331 Vly Rd
- 2808 Troy Schenectady Rd
- 76 Tamarack Ln
- 227 Shaker Ridge Dr
- 31 Amelia Dr
- 4 Dahlem Blvd
- 66 Shinnecock Hills Dr
- 871 Maxwell Dr
- 145 Killarney Dr
- 18 Dublin Dr
- 65 Dublin Dr
- 647 Pearse Rd
- 5 Emmett Dr
- 30 Priddle Ln
- 77 Ash Tree Ln
- 79 Ash Tree Ln
- 79 Ash Tree La
- 75 Ash Tree Ln
- 17 Tamarack Ln
- 15 Tamarack Ln
- 81 Ash Tree Ln
- 80 Ash Tree Ln
- 78 Ash Tree Ln
- 80 Ash Tree La
- 13 Tamarack Ln
- 76 Ash Tree Ln
- 82 Ash Tree Ln
- 83 Ash Tree Ln
- 6 Walnut Ln E
- 11 Tamarack Ln
- 84 Ash Tree Ln
- 46 Tamarack Ln
- 77 Birchwood Ln
- 79 Birchwood Ln
Your Personal Tour Guide
Ask me questions while you tour the home.