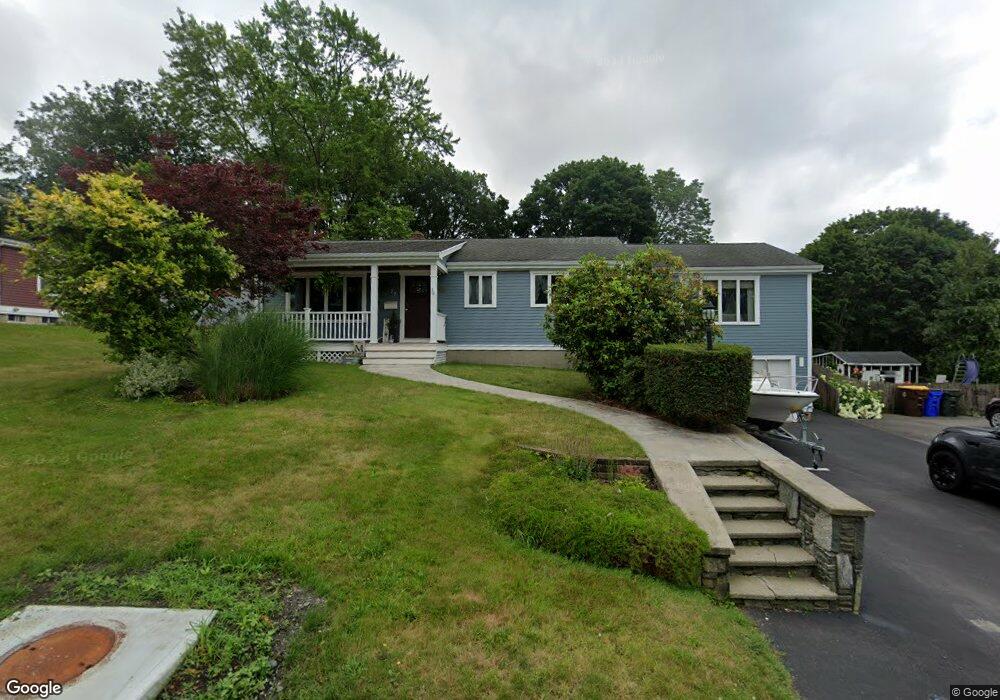
77 Baldwin St Fall River, MA 02720
Western Fall River NeighborhoodEstimated Value: $419,000 - $539,000
4
Beds
3
Baths
2,020
Sq Ft
$241/Sq Ft
Est. Value
About This Home
This home is located at 77 Baldwin St, Fall River, MA 02720 and is currently estimated at $486,842, approximately $241 per square foot. 77 Baldwin St is a home located in Bristol County with nearby schools including North End Elementary School, Morton Middle School, and B M C Durfee High School.
Ownership History
Date
Name
Owned For
Owner Type
Purchase Details
Closed on
May 17, 1999
Sold by
Michael Glenna T
Bought by
Michael Edwards
Current Estimated Value
Create a Home Valuation Report for This Property
The Home Valuation Report is an in-depth analysis detailing your home's value as well as a comparison with similar homes in the area
Home Values in the Area
Average Home Value in this Area
Purchase History
| Date | Buyer | Sale Price | Title Company |
|---|---|---|---|
| Michael Edwards | $143,750 | -- |
Source: Public Records
Mortgage History
| Date | Status | Borrower | Loan Amount |
|---|---|---|---|
| Open | Michael Edwards | $215,000 | |
| Closed | Michael Edwards | $216,000 | |
| Closed | Michael Edwards | $25,000 |
Source: Public Records
Tax History
| Year | Tax Paid | Tax Assessment Tax Assessment Total Assessment is a certain percentage of the fair market value that is determined by local assessors to be the total taxable value of land and additions on the property. | Land | Improvement |
|---|---|---|---|---|
| 2025 | $4,327 | $377,900 | $121,900 | $256,000 |
| 2024 | $4,056 | $353,000 | $119,500 | $233,500 |
| 2023 | $3,924 | $319,800 | $107,700 | $212,100 |
| 2022 | $3,233 | $273,500 | $101,600 | $171,900 |
| 2021 | $3,233 | $233,800 | $97,000 | $136,800 |
| 2020 | $3,111 | $215,300 | $92,600 | $122,700 |
| 2019 | $3,072 | $210,700 | $96,800 | $113,900 |
| 2018 | $3,038 | $207,800 | $97,500 | $110,300 |
| 2017 | $2,883 | $205,900 | $97,500 | $108,400 |
| 2016 | $2,772 | $203,400 | $100,500 | $102,900 |
| 2015 | $2,732 | $208,900 | $100,500 | $108,400 |
| 2014 | $2,628 | $208,900 | $100,500 | $108,400 |
Source: Public Records
Map
Nearby Homes
- 33 Warner St
- 257 Calvin St
- 1810 Highland Ave Unit 22
- Parcel 2 Highcrest Rd
- 3636 N Main St Unit 5
- 29 Valentine St
- 274 Archer St
- 210 Harrison Ave
- 195 Crescent St Unit 3
- 2714 Riverside Ave
- 108 Stowe St Unit 108
- 2106 Meridian St
- 1553 Riverside Ave
- 54 Grant Ave
- 247 Albany St
- 230 College Park Rd
- 1496 Riverside Ave
- 201 Montgomery Cir
- 333 Langley St
- 17 Langley St
Your Personal Tour Guide
Ask me questions while you tour the home.