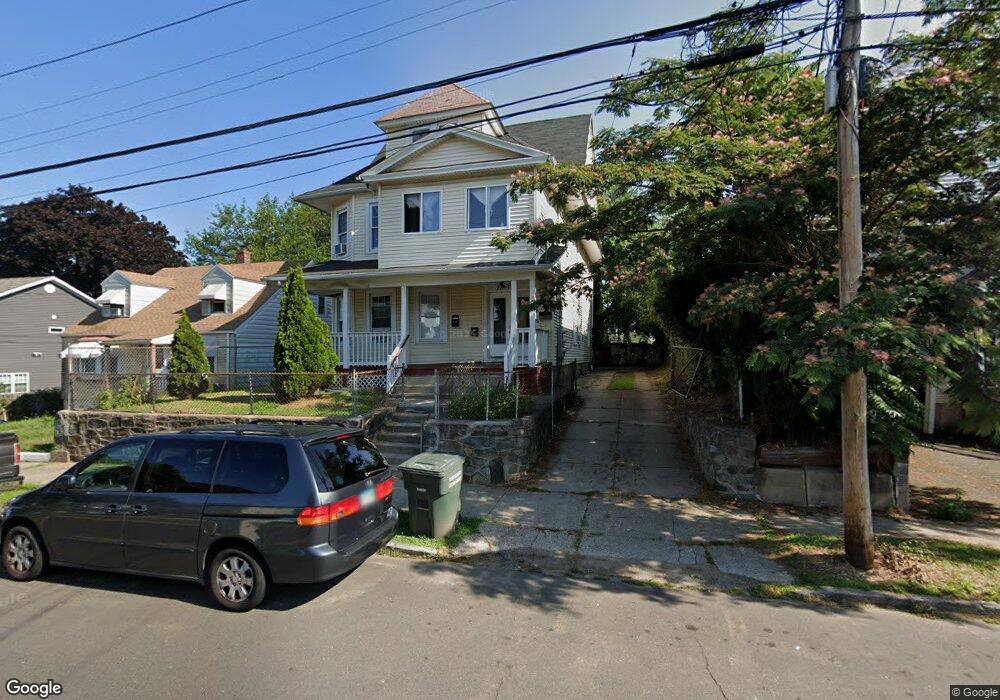
77 Concord St Bridgeport, CT 06610
North Bridgeport NeighborhoodEstimated Value: $598,000 - $660,000
6
Beds
3
Baths
3,303
Sq Ft
$194/Sq Ft
Est. Value
About This Home
This home is located at 77 Concord St, Bridgeport, CT 06610 and is currently estimated at $639,562, approximately $193 per square foot. 77 Concord St is a home located in Fairfield County with nearby schools including Beardsley School, Harding High School, and Achievement First Bridgeport Academy Elementary School.
Ownership History
Date
Name
Owned For
Owner Type
Purchase Details
Closed on
Jan 25, 2021
Sold by
Bros Mgmt Llc
Bought by
Sxmb Bpt Llc
Current Estimated Value
Purchase Details
Closed on
Aug 20, 2007
Sold by
Iras Ana Maria
Bought by
Picozo Teresa and Picozo Martha
Home Financials for this Owner
Home Financials are based on the most recent Mortgage that was taken out on this home.
Original Mortgage
$417,449
Interest Rate
6.67%
Purchase Details
Closed on
May 1, 2003
Sold by
Ae Investors Llc
Bought by
Islas Ana M
Purchase Details
Closed on
Jan 23, 2001
Sold by
Bajda John
Bought by
A & E Investors Llc
Purchase Details
Closed on
Aug 31, 2000
Sold by
Ocwen Fed Bk Fsb
Bought by
Bajda John
Purchase Details
Closed on
Dec 16, 1994
Sold by
Matosian Ed G and Matosian Elma
Bought by
Vanduzen Miriam G and Vanduzen Demetrius
Create a Home Valuation Report for This Property
The Home Valuation Report is an in-depth analysis detailing your home's value as well as a comparison with similar homes in the area
Home Values in the Area
Average Home Value in this Area
Purchase History
| Date | Buyer | Sale Price | Title Company |
|---|---|---|---|
| Sxmb Bpt Llc | -- | None Available | |
| Sxmb Bpt Llc | -- | None Available | |
| Picozo Teresa | $424,000 | -- | |
| Picozo Teresa | $424,000 | -- | |
| Islas Ana M | $290,000 | -- | |
| Islas Ana M | $290,000 | -- | |
| A & E Investors Llc | $87,000 | -- | |
| A & E Investors Llc | $87,000 | -- | |
| Bajda John | $61,000 | -- | |
| Bajda John | $61,000 | -- | |
| Vanduzen Miriam G | $103,000 | -- |
Source: Public Records
Mortgage History
| Date | Status | Borrower | Loan Amount |
|---|---|---|---|
| Previous Owner | Vanduzen Miriam G | $417,449 |
Source: Public Records
Tax History
| Year | Tax Paid | Tax Assessment Tax Assessment Total Assessment is a certain percentage of the fair market value that is determined by local assessors to be the total taxable value of land and additions on the property. | Land | Improvement |
|---|---|---|---|---|
| 2025 | $8,768 | $201,800 | $50,900 | $150,900 |
| 2024 | $8,768 | $201,800 | $50,900 | $150,900 |
| 2023 | $8,768 | $201,800 | $50,900 | $150,900 |
| 2022 | $8,768 | $201,800 | $50,900 | $150,900 |
| 2021 | $8,768 | $201,800 | $50,900 | $150,900 |
| 2020 | $8,941 | $165,600 | $49,180 | $116,420 |
| 2019 | $8,941 | $165,600 | $49,180 | $116,420 |
| 2018 | $9,004 | $165,600 | $49,180 | $116,420 |
| 2017 | $9,004 | $165,600 | $49,180 | $116,420 |
| 2016 | $9,004 | $165,600 | $49,180 | $116,420 |
| 2015 | $8,316 | $197,070 | $53,790 | $143,280 |
| 2014 | $8,316 | $197,070 | $53,790 | $143,280 |
Source: Public Records
Map
Nearby Homes
- 142 Palm St
- 386-388 Huntington Rd
- 2031 E Main St
- 2034 E Main St
- 744 Park St
- 2092-2096 E Main St
- 2100-2102 E Main St
- 46 York St
- 100-102 Ashley St
- 1218 Kossuth St
- 750 William St
- 500 Park St
- 619 Brooks St Unit 621
- 690 William St
- 502 Berkshire Ave
- 1365 E Main St
- 108 Lindley St Unit 114
- 369 Park St
- 1389 Pembroke St
- 34-40 Hayes St
- 77 Concord St Unit 3
- 77 Concord St Unit 2
- 65 Concord St Unit 67
- 67 Concord St
- 65-67 Concord St
- 55 Concord St
- 75 Concord St Unit 1
- 75 Concord St
- 84 Locust St
- 94 Locust St Unit 96
- 70 Concord St
- 80 Concord St
- 45 Concord St
- 96 Locust St
- 64 Concord St
- 93 Concord St Unit 97
- 551 Huntington Rd
- 58 Concord St
- 74 Locust St Unit 76
- 104 Locust St Unit 106
Your Personal Tour Guide
Ask me questions while you tour the home.