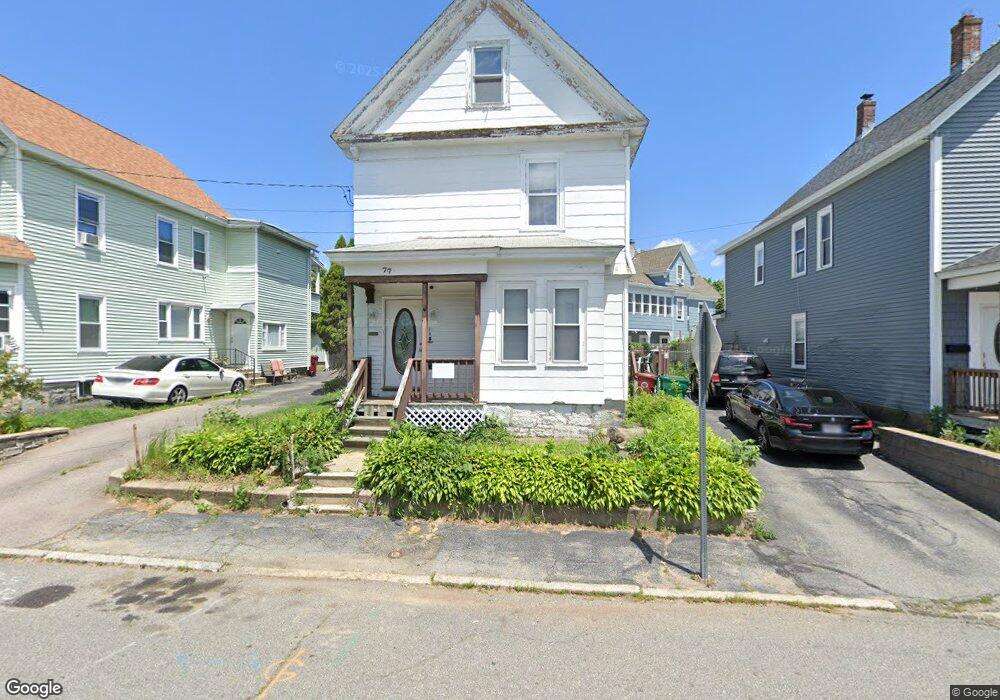
77 Dalton St Lowell, MA 01850
Centralville NeighborhoodEstimated Value: $438,000 - $660,000
1
Bed
2
Baths
950
Sq Ft
$584/Sq Ft
Est. Value
About This Home
Looking for a bright and modern place to call home? This large one-bedroom apartment offers the perfect balance of comfort and convenience just minutes from UMass Lowell.
Ownership History
Date
Name
Owned For
Owner Type
Purchase Details
Closed on
Jul 15, 2011
Sold by
Carbonneau Raymond P
Bought by
Lopez William N and Lopez Peter B
Current Estimated Value
Home Financials for this Owner
Home Financials are based on the most recent Mortgage that was taken out on this home.
Original Mortgage
$171,000
Outstanding Balance
$118,031
Interest Rate
4.58%
Mortgage Type
Purchase Money Mortgage
Estimated Equity
$436,773
Create a Home Valuation Report for This Property
The Home Valuation Report is an in-depth analysis detailing your home's value as well as a comparison with similar homes in the area
Home Values in the Area
Average Home Value in this Area
Purchase History
| Date | Buyer | Sale Price | Title Company |
|---|---|---|---|
| Lopez William N | $180,000 | -- | |
| Lopez William N | $180,000 | -- |
Source: Public Records
Mortgage History
| Date | Status | Borrower | Loan Amount |
|---|---|---|---|
| Open | Lopez William N | $171,000 | |
| Closed | Lopez William N | $171,000 |
Source: Public Records
Property History
| Date | Event | Price | List to Sale | Price per Sq Ft |
|---|---|---|---|---|
| 10/08/2024 10/08/24 | Off Market | $1,800 | -- | -- |
| 10/01/2024 10/01/24 | For Rent | $1,850 | +2.8% | -- |
| 09/26/2024 09/26/24 | Price Changed | $1,800 | -- | $2 / Sq Ft |
Tax History
| Year | Tax Paid | Tax Assessment Tax Assessment Total Assessment is a certain percentage of the fair market value that is determined by local assessors to be the total taxable value of land and additions on the property. | Land | Improvement |
|---|---|---|---|---|
| 2025 | $5,756 | $501,400 | $117,300 | $384,100 |
| 2024 | $5,293 | $444,400 | $104,800 | $339,600 |
| 2023 | $4,846 | $390,200 | $84,800 | $305,400 |
| 2022 | $4,435 | $349,500 | $73,200 | $276,300 |
| 2021 | $4,116 | $305,800 | $63,700 | $242,100 |
| 2020 | $3,980 | $297,900 | $74,600 | $223,300 |
| 2019 | $3,655 | $260,300 | $62,100 | $198,200 |
| 2018 | $3,406 | $236,700 | $59,100 | $177,600 |
| 2017 | $3,150 | $211,100 | $49,000 | $162,100 |
| 2016 | $2,762 | $182,200 | $45,400 | $136,800 |
| 2015 | $2,551 | $164,800 | $45,400 | $119,400 |
| 2013 | $2,549 | $169,800 | $52,300 | $117,500 |
Source: Public Records
Map
Nearby Homes
- 26 Farmland Rd Unit C
- 15 Dana St
- 345 Hildreth St Unit 14
- 367 Hildreth St Unit 14
- 27 Bunker Hill Ave
- 417 Hildreth St Unit 30
- 52 Lawrence Dr Unit 206
- 99 W 6th St
- 16 Peabody Ave
- 23 18th St
- 35 Whitney Ave Unit 33
- 174 River Rd
- 75 Sladen St
- 49 Sparks St
- 18 May St
- 45 W 4th St
- 106 Methuen St Unit B
- 551 Hildreth St Unit 10
- 70 Austin St Unit 15
- 39 Phoebe Ave
Your Personal Tour Guide
Ask me questions while you tour the home.