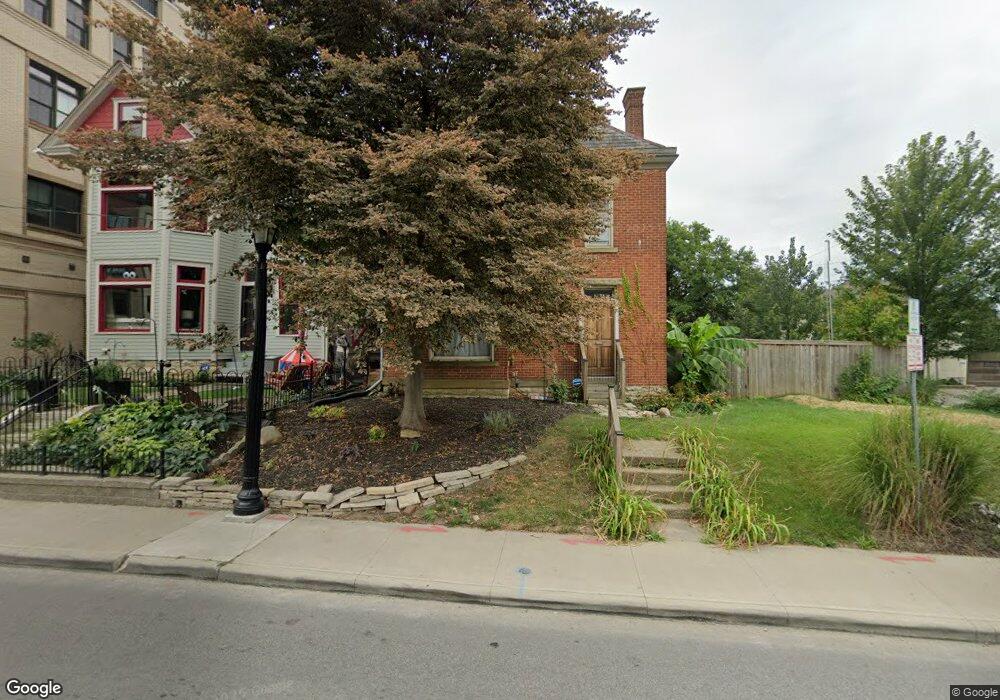
77 E 5th Ave Columbus, OH 43201
Italian Village NeighborhoodEstimated Value: $445,000 - $595,000
2
Beds
2
Baths
2,154
Sq Ft
$254/Sq Ft
Est. Value
About This Home
This home is located at 77 E 5th Ave, Columbus, OH 43201 and is currently estimated at $546,383, approximately $253 per square foot. 77 E 5th Ave is a home located in Franklin County with nearby schools including Weinland Park Elementary School, Dominion Middle School, and Whetstone High School.
Ownership History
Date
Name
Owned For
Owner Type
Purchase Details
Closed on
Jan 16, 2015
Sold by
Larson Elaine and Meindl Elaine
Bought by
Gilson Kevin J
Current Estimated Value
Home Financials for this Owner
Home Financials are based on the most recent Mortgage that was taken out on this home.
Original Mortgage
$166,360
Outstanding Balance
$126,077
Interest Rate
3.87%
Mortgage Type
FHA
Estimated Equity
$420,306
Purchase Details
Closed on
May 7, 2004
Sold by
Gartland Brian A
Bought by
Larson Elaine
Home Financials for this Owner
Home Financials are based on the most recent Mortgage that was taken out on this home.
Original Mortgage
$150,000
Interest Rate
5.91%
Mortgage Type
Purchase Money Mortgage
Purchase Details
Closed on
Jun 6, 1998
Sold by
Mcmasters J A
Bought by
Gartland Brian A
Purchase Details
Closed on
Nov 21, 1989
Create a Home Valuation Report for This Property
The Home Valuation Report is an in-depth analysis detailing your home's value as well as a comparison with similar homes in the area
Home Values in the Area
Average Home Value in this Area
Purchase History
| Date | Buyer | Sale Price | Title Company |
|---|---|---|---|
| Gilson Kevin J | $169,500 | Landsel Title | |
| Larson Elaine | $210,000 | Amerititle | |
| Gartland Brian A | $61,500 | Chicago Title West | |
| -- | $15,000 | -- |
Source: Public Records
Mortgage History
| Date | Status | Borrower | Loan Amount |
|---|---|---|---|
| Open | Gilson Kevin J | $166,360 | |
| Previous Owner | Larson Elaine | $150,000 |
Source: Public Records
Tax History
| Year | Tax Paid | Tax Assessment Tax Assessment Total Assessment is a certain percentage of the fair market value that is determined by local assessors to be the total taxable value of land and additions on the property. | Land | Improvement |
|---|---|---|---|---|
| 2025 | $8,590 | $170,820 | $75,260 | $95,560 |
| 2024 | $8,590 | $170,820 | $75,260 | $95,560 |
| 2023 | $8,492 | $170,820 | $75,260 | $95,560 |
| 2022 | $8,351 | $143,200 | $42,530 | $100,670 |
| 2021 | $8,179 | $143,200 | $42,530 | $100,670 |
| 2020 | $8,189 | $143,200 | $42,530 | $100,670 |
| 2019 | $6,435 | $106,070 | $31,510 | $74,560 |
| 2018 | $5,479 | $106,070 | $31,510 | $74,560 |
| 2017 | $5,714 | $106,070 | $31,510 | $74,560 |
| 2016 | $4,997 | $75,440 | $23,250 | $52,190 |
| 2015 | $4,536 | $75,440 | $23,250 | $52,190 |
| 2014 | $4,548 | $75,440 | $23,250 | $52,190 |
| 2013 | $745 | $25,060 | $5,005 | $20,055 |
Source: Public Records
Map
Nearby Homes
- 138 E Greenwood Ave
- 1151 Summit St
- 1149 Summit St
- 1158 Summit St
- 1152 Summit St
- 1136 Summit St
- 1276 N High St Unit 402
- 156 E 4th Ave
- 1145 N High St Unit 203
- 1145 N High St Unit 404
- 1145 N High St Unit 307
- 1131 N High St Unit 301
- 18 W 4th Ave
- 30 W 4th Ave
- 63 Smith Place
- 1046 Summit St
- 249 E Greenwood Ave
- 1342 Hamlet St Unit 344
- 17 W 3rd Ave Unit 212
- 17 W 3rd Ave Unit 213
- 85 E 5th Ave
- 1181 Say Ave Unit 2
- 1181 Say Ave
- 71 E 5th Ave
- 71 E 5th Ave Unit 1
- 71 E 5th Ave Unit 2
- 67 E 5th Ave
- 67 E 5th Ave Unit 1
- 67 E 5th Ave Unit 2
- 1172 Say Ave
- 1173 Say Ave
- 63 E 5th Ave
- 126 E Greenwood Ave
- 1202 Indianola Ave
- 1202 Indianola Ave Unit 2
- 1171 Say Ave
- 128 E Greenwood Ave
- 1167 Say Ave
- 1204 Indianola Ave
- 59 E 5th Ave
Your Personal Tour Guide
Ask me questions while you tour the home.