77 Greenleaf Dr Eagle Point, OR 97524
Estimated Value: $550,815 - $685,000
3
Beds
4
Baths
2,080
Sq Ft
$295/Sq Ft
Est. Value
About This Home
This home is located at 77 Greenleaf Dr, Eagle Point, OR 97524 and is currently estimated at $612,605, approximately $294 per square foot. 77 Greenleaf Dr is a home located in Jackson County with nearby schools including Eagle Point Middle School, White Mountain Middle School, and Eagle Point High School.
Ownership History
Date
Name
Owned For
Owner Type
Purchase Details
Closed on
Mar 23, 2006
Sold by
Simpson Scott D and Simpson Debbie J
Bought by
Andersen Marvin J and Andersen Michelle K
Current Estimated Value
Home Financials for this Owner
Home Financials are based on the most recent Mortgage that was taken out on this home.
Original Mortgage
$381,600
Outstanding Balance
$213,000
Interest Rate
6.25%
Mortgage Type
Fannie Mae Freddie Mac
Estimated Equity
$399,605
Purchase Details
Closed on
Mar 15, 1999
Sold by
Carl James
Bought by
Simpson Scott D and Simpson Debbie J
Home Financials for this Owner
Home Financials are based on the most recent Mortgage that was taken out on this home.
Original Mortgage
$105,200
Interest Rate
6.73%
Create a Home Valuation Report for This Property
The Home Valuation Report is an in-depth analysis detailing your home's value as well as a comparison with similar homes in the area
Purchase History
| Date | Buyer | Sale Price | Title Company |
|---|---|---|---|
| Andersen Marvin J | $477,000 | Ticor Title | |
| Simpson Scott D | $70,500 | Crater Title Insurance |
Source: Public Records
Mortgage History
| Date | Status | Borrower | Loan Amount |
|---|---|---|---|
| Open | Andersen Marvin J | $381,600 | |
| Previous Owner | Simpson Scott D | $105,200 |
Source: Public Records
Tax History
| Year | Tax Paid | Tax Assessment Tax Assessment Total Assessment is a certain percentage of the fair market value that is determined by local assessors to be the total taxable value of land and additions on the property. | Land | Improvement |
|---|---|---|---|---|
| 2026 | $2,828 | $257,321 | -- | -- |
| 2025 | $2,498 | $268,815 | $77,645 | $191,170 |
| 2024 | $2,498 | $220,469 | $75,489 | $144,980 |
| 2023 | $2,413 | $214,174 | $73,404 | $140,770 |
| 2022 | $2,352 | $214,174 | $73,404 | $140,770 |
| 2021 | $2,285 | $208,059 | $71,389 | $136,670 |
| 2020 | $2,482 | $202,124 | $69,424 | $132,700 |
| 2019 | $2,455 | $190,766 | $65,666 | $125,100 |
| 2018 | $2,402 | $185,333 | $63,873 | $121,460 |
| 2017 | $2,347 | $185,333 | $63,873 | $121,460 |
| 2016 | $2,289 | $174,938 | $60,428 | $114,510 |
| 2015 | $2,213 | $174,938 | $60,428 | $114,510 |
| 2014 | $2,151 | $165,134 | $57,184 | $107,950 |
Source: Public Records
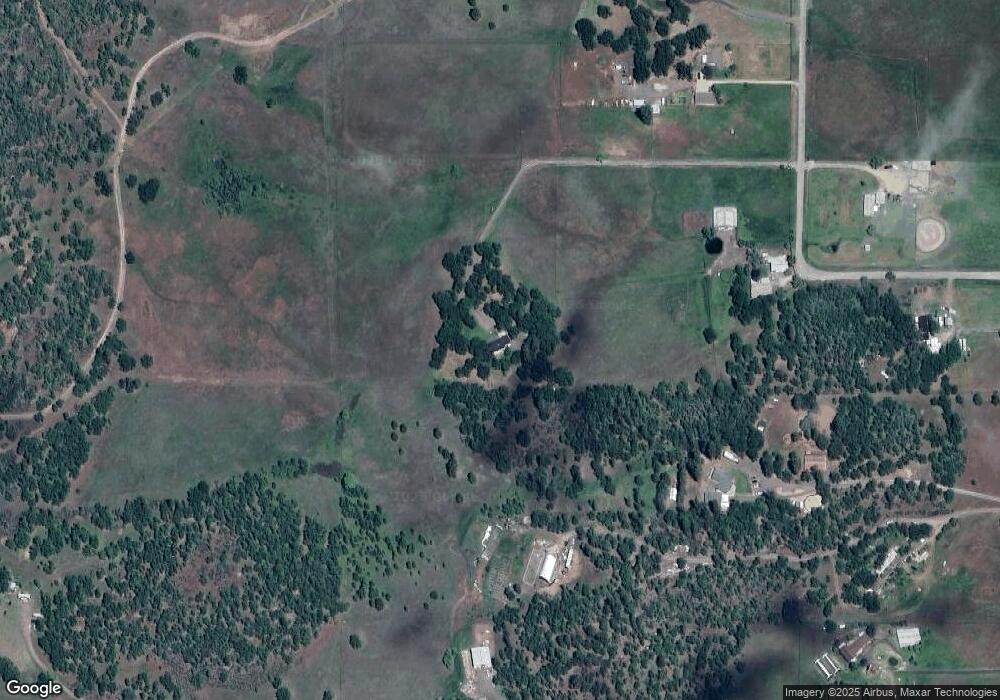
Map
Nearby Homes
- 0 Rogue River Dr Unit 220215041
- 506 Greenleaf Dr
- 2900 Rogue River Dr
- 198 Flamingo Dr
- 510 Chateau Dr
- 533 Chateau Dr
- 1583 Highway 234
- 120 Hammel Rd
- 0 Winnetka Rd
- 7426 Denman Ct
- 110 Mcdonalds Way
- 21 Brophy Way Unit 17
- 0 Antioch Rd Unit TL 407
- 0 Antioch Rd Unit TL 406
- 20055 Highway 62 Unit 1
- 20055 Highway 62 Unit 49
- 200 Sierra Dr
- 363 Kitty Dr
- 20140 Highway 62
- 20455 Highway 62
- 1945 Rogue River Dr
- 11 Greenleaf Dr
- 115 Greenleaf Dr
- 155 Greenleaf Dr
- 108 Greenleaf Dr
- 1897 Rogue River Dr
- 1747 Rogue River Dr
- 1829 Rogue River Dr
- 421 Greenleaf Dr
- 0 Rogue River Dr Unit 100269102
- 0 Rogue River Dr Unit 100080407
- 0 Rogue River Dr Unit 100994842
- 0 Rogue River Dr Unit 100980282
- 0 Rogue River Dr Unit 100972025
- 0 Rogue River Dr Unit 100230401
- 0 Rogue River Dr Unit 100992538
- 0 Rogue River Dr Unit 100995284
- 0 Rogue River Dr Unit 100983985
- 0 Rogue River Dr Unit 100983411
- 0 Rogue River Dr Unit 100981516
Your Personal Tour Guide
Ask me questions while you tour the home.