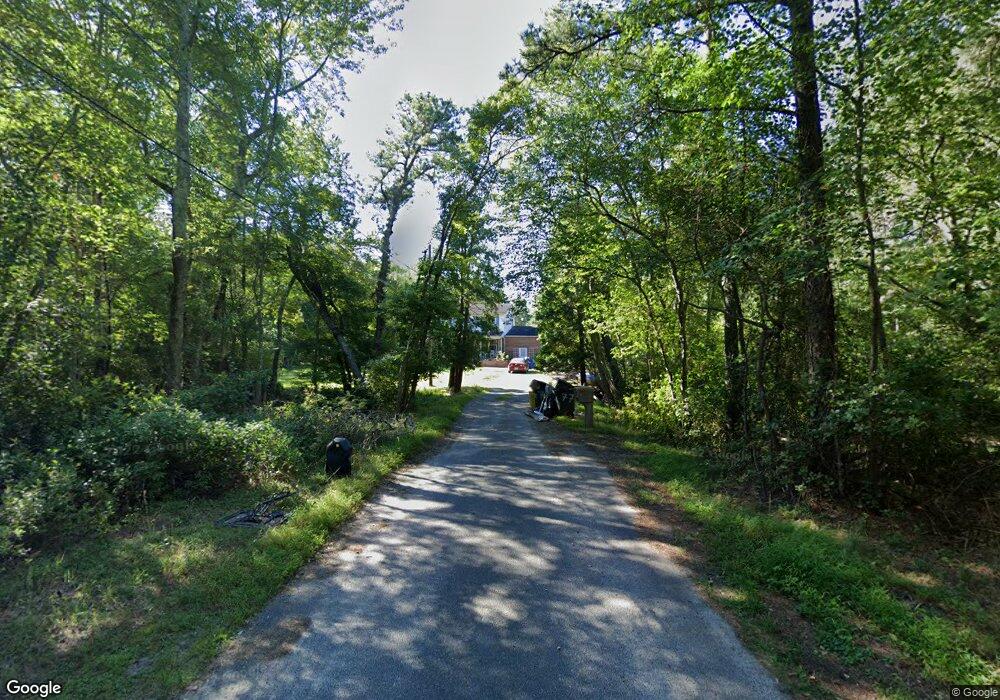
77 Grouse St Browns Mills, NJ 08015
Estimated Value: $371,000 - $472,000
--
Bed
--
Bath
2,516
Sq Ft
$166/Sq Ft
Est. Value
About This Home
This home is located at 77 Grouse St, Browns Mills, NJ 08015 and is currently estimated at $417,360, approximately $165 per square foot. 77 Grouse St is a home located in Burlington County.
Ownership History
Date
Name
Owned For
Owner Type
Purchase Details
Closed on
Feb 26, 2001
Sold by
Lawrence Glenville and Lawrence Roslyn R
Bought by
Lorenzo Helene
Current Estimated Value
Home Financials for this Owner
Home Financials are based on the most recent Mortgage that was taken out on this home.
Original Mortgage
$152,656
Outstanding Balance
$56,127
Interest Rate
7.15%
Mortgage Type
FHA
Estimated Equity
$361,233
Purchase Details
Closed on
Jul 30, 1999
Sold by
Brown John W and Brown Michele E
Bought by
Lawrence Glenville and Lawrence Roslyn R
Home Financials for this Owner
Home Financials are based on the most recent Mortgage that was taken out on this home.
Original Mortgage
$127,710
Interest Rate
7.85%
Mortgage Type
FHA
Create a Home Valuation Report for This Property
The Home Valuation Report is an in-depth analysis detailing your home's value as well as a comparison with similar homes in the area
Home Values in the Area
Average Home Value in this Area
Purchase History
| Date | Buyer | Sale Price | Title Company |
|---|---|---|---|
| Lorenzo Helene | $153,900 | -- | |
| Lawrence Glenville | $134,900 | -- |
Source: Public Records
Mortgage History
| Date | Status | Borrower | Loan Amount |
|---|---|---|---|
| Open | Lorenzo Helene | $152,656 | |
| Previous Owner | Lawrence Glenville | $127,710 |
Source: Public Records
Tax History Compared to Growth
Tax History
| Year | Tax Paid | Tax Assessment Tax Assessment Total Assessment is a certain percentage of the fair market value that is determined by local assessors to be the total taxable value of land and additions on the property. | Land | Improvement |
|---|---|---|---|---|
| 2025 | $7,417 | $242,000 | $48,000 | $194,000 |
| 2024 | $6,960 | $242,000 | $48,000 | $194,000 |
| 2023 | $6,960 | $242,000 | $48,000 | $194,000 |
| 2022 | $6,442 | $242,000 | $48,000 | $194,000 |
| 2021 | $6,178 | $242,000 | $48,000 | $194,000 |
| 2020 | $5,946 | $242,000 | $48,000 | $194,000 |
| 2019 | $5,694 | $242,000 | $48,000 | $194,000 |
| 2018 | $5,501 | $242,000 | $48,000 | $194,000 |
| 2017 | $5,387 | $242,000 | $48,000 | $194,000 |
| 2016 | $4,276 | $114,400 | $16,100 | $98,300 |
| 2015 | $4,242 | $114,400 | $16,100 | $98,300 |
| 2014 | $4,055 | $114,400 | $16,100 | $98,300 |
Source: Public Records
Map
Nearby Homes