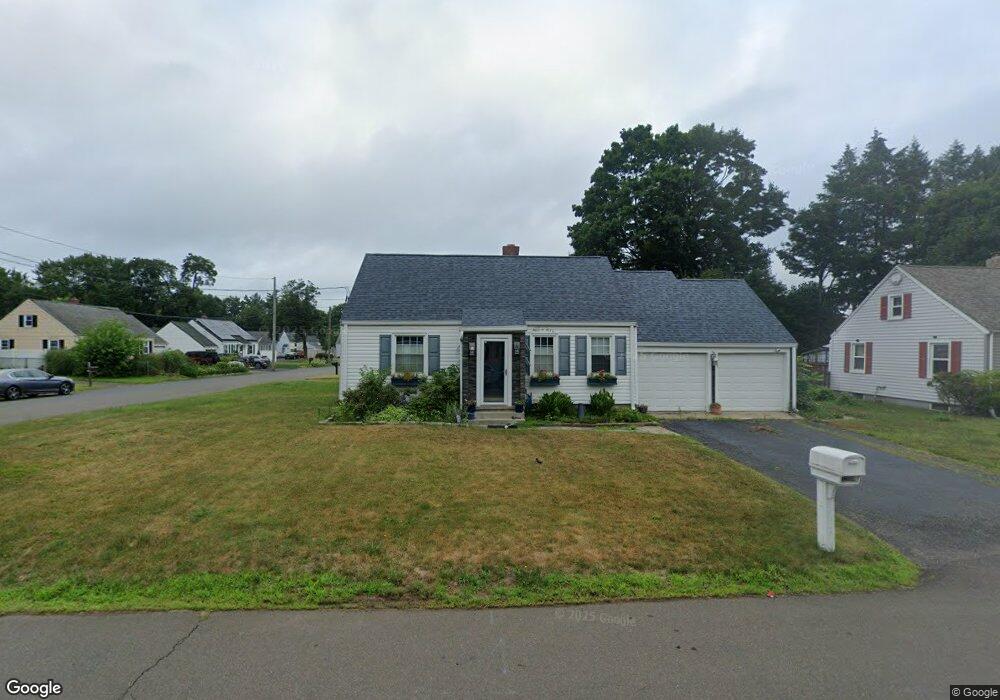
77 Hayward Rd Hamden, CT 06514
Estimated Value: $292,000 - $351,000
2
Beds
1
Bath
991
Sq Ft
$315/Sq Ft
Est. Value
About This Home
This home is located at 77 Hayward Rd, Hamden, CT 06514 and is currently estimated at $311,738, approximately $314 per square foot. 77 Hayward Rd is a home located in New Haven County with nearby schools including Church Street School, Hamden Middle School, and Hamden High School.
Ownership History
Date
Name
Owned For
Owner Type
Purchase Details
Closed on
Sep 2, 1997
Sold by
Turner Paul
Bought by
Kaplan Marcia S
Current Estimated Value
Home Financials for this Owner
Home Financials are based on the most recent Mortgage that was taken out on this home.
Original Mortgage
$94,050
Interest Rate
7.41%
Mortgage Type
Unknown
Purchase Details
Closed on
Jan 16, 1987
Sold by
Est Alice C Keres
Bought by
Turner Paul
Create a Home Valuation Report for This Property
The Home Valuation Report is an in-depth analysis detailing your home's value as well as a comparison with similar homes in the area
Home Values in the Area
Average Home Value in this Area
Purchase History
We collect this data history from publicly available records. To have your information removed, we recommend requesting removal directly through your county’s website.
| Date | Buyer | Sale Price | Title Company |
|---|---|---|---|
| Kaplan Marcia S | $102,000 | -- | |
| Turner Paul | $115,000 | -- |
Source: Public Records
Mortgage History
We collect this data history from publicly available records. To have your information removed, we recommend requesting removal directly through your county’s website.
| Date | Status | Borrower | Loan Amount |
|---|---|---|---|
| Open | Turner Paul | $112,750 | |
| Closed | Turner Paul | $116,500 | |
| Closed | Turner Paul | $91,200 | |
| Closed | Turner Paul | $94,050 |
Source: Public Records
Tax History
| Year | Tax Paid | Tax Assessment Tax Assessment Total Assessment is a certain percentage of the fair market value that is determined by local assessors to be the total taxable value of land and additions on the property. | Land | Improvement |
|---|---|---|---|---|
| 2025 | $8,643 | $166,600 | $55,230 | $111,370 |
| 2024 | $5,855 | $105,280 | $30,590 | $74,690 |
| 2023 | $5,936 | $105,280 | $30,590 | $74,690 |
| 2022 | $5,841 | $105,280 | $30,590 | $74,690 |
| 2021 | $5,521 | $105,280 | $30,590 | $74,690 |
| 2020 | $4,777 | $91,910 | $40,810 | $51,100 |
| 2019 | $4,491 | $91,910 | $40,810 | $51,100 |
| 2018 | $4,408 | $91,910 | $40,810 | $51,100 |
| 2017 | $4,160 | $91,910 | $40,810 | $51,100 |
| 2016 | $4,169 | $91,910 | $40,810 | $51,100 |
| 2015 | $4,494 | $109,970 | $51,030 | $58,940 |
| 2014 | $4,391 | $109,970 | $51,030 | $58,940 |
Source: Public Records
Map
Nearby Homes
- 59 Hayward Rd
- 2 Village Cir Unit 2
- 336 Circular Ave
- 45 Dennis Cir
- 131 Chester St
- 30 Lucy St
- 75 Concord St
- 50 Pleasant Dr
- 4 Dallas St
- 100 Wintergreen Ave
- 79 W Helen St
- 169 Battis Rd
- 160 Wilmot Rd
- 1428 Dixwell Ave
- 19 Cumley St
- 1422 Dixwell Ave
- 1412 Dixwell Ave
- 63 Gorham Ave
- 136 Harrison Dr
- 26 Newton St
Your Personal Tour Guide
Ask me questions while you tour the home.