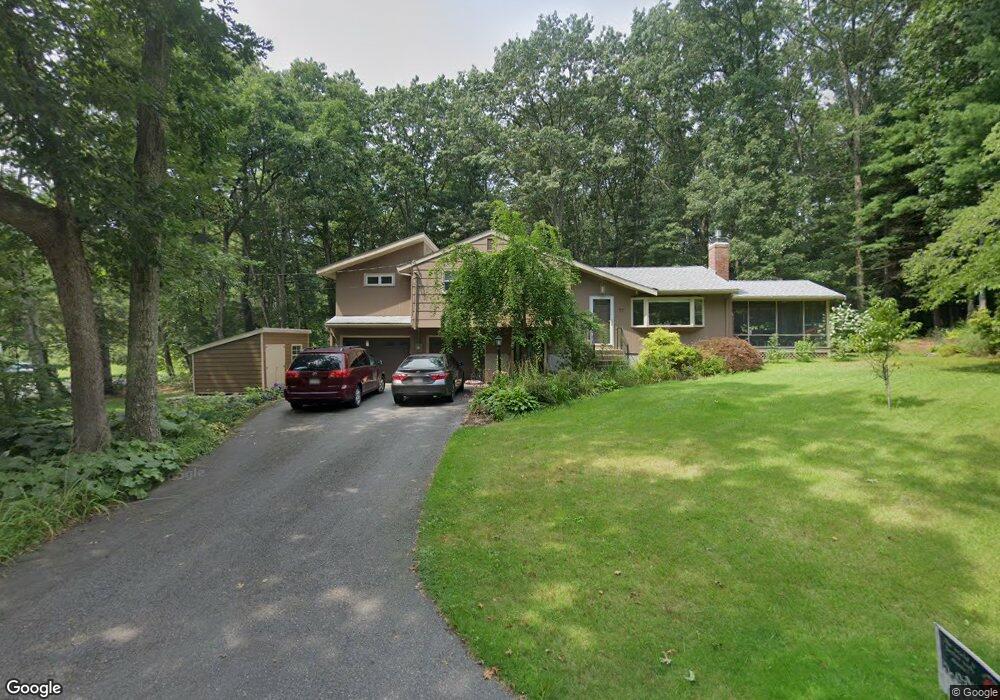
77 Hemlock Rd Sudbury, MA 01776
Estimated Value: $852,167 - $990,000
3
Beds
2
Baths
1,574
Sq Ft
$577/Sq Ft
Est. Value
About This Home
This home is located at 77 Hemlock Rd, Sudbury, MA 01776 and is currently estimated at $908,542, approximately $577 per square foot. 77 Hemlock Rd is a home located in Middlesex County with nearby schools including Peter Noyes Elementary School, Ephraim Curtis Middle School, and Lincoln-Sudbury Regional High School.
Ownership History
Date
Name
Owned For
Owner Type
Purchase Details
Closed on
Jun 10, 2025
Sold by
Dar Yaron and Kupiec-Dar Yael R
Bought by
Yaron Dar Ret and Dar
Current Estimated Value
Purchase Details
Closed on
Jul 21, 2004
Sold by
Jones David M and Steele Sabrina K
Bought by
Cendant Mobilit Fncl C and Cendant Kupiec-Dar
Home Financials for this Owner
Home Financials are based on the most recent Mortgage that was taken out on this home.
Original Mortgage
$312,500
Interest Rate
6.28%
Mortgage Type
Purchase Money Mortgage
Purchase Details
Closed on
Jun 16, 2003
Sold by
Tessel John D
Bought by
Jones David M and Steele Sabrina K
Purchase Details
Closed on
May 15, 1996
Sold by
Prager Lawrence and Prager Phyllis
Bought by
Tessel Milton B and Tessel Eleanor J
Create a Home Valuation Report for This Property
The Home Valuation Report is an in-depth analysis detailing your home's value as well as a comparison with similar homes in the area
Home Values in the Area
Average Home Value in this Area
Purchase History
| Date | Buyer | Sale Price | Title Company |
|---|---|---|---|
| Yaron Dar Ret | -- | -- | |
| Cendant Mobilit Fncl C | $482,500 | -- | |
| Cendant Mobilit Fncl C | $482,500 | -- | |
| Jones David M | $400,000 | -- | |
| Jones David M | $400,000 | -- | |
| Tessel Milton B | $217,250 | -- | |
| Tessel Milton B | $217,250 | -- |
Source: Public Records
Mortgage History
| Date | Status | Borrower | Loan Amount |
|---|---|---|---|
| Previous Owner | Tessel Milton B | $290,000 | |
| Previous Owner | Tessel Milton B | $294,000 | |
| Previous Owner | Cendant Mobilit Fncl C | $312,500 |
Source: Public Records
Tax History Compared to Growth
Tax History
| Year | Tax Paid | Tax Assessment Tax Assessment Total Assessment is a certain percentage of the fair market value that is determined by local assessors to be the total taxable value of land and additions on the property. | Land | Improvement |
|---|---|---|---|---|
| 2025 | $11,446 | $781,800 | $417,000 | $364,800 |
| 2024 | $11,067 | $757,500 | $404,800 | $352,700 |
| 2023 | $11,012 | $698,300 | $374,800 | $323,500 |
| 2022 | $10,260 | $568,400 | $344,000 | $224,400 |
| 2021 | $9,880 | $524,700 | $344,000 | $180,700 |
| 2020 | $9,681 | $524,700 | $344,000 | $180,700 |
| 2019 | $9,397 | $524,700 | $344,000 | $180,700 |
| 2018 | $9,411 | $524,900 | $366,800 | $158,100 |
| 2017 | $8,808 | $496,500 | $348,900 | $147,600 |
| 2016 | $8,030 | $451,100 | $335,600 | $115,500 |
| 2015 | $7,566 | $429,900 | $322,700 | $107,200 |
| 2014 | $7,529 | $417,600 | $313,200 | $104,400 |
Source: Public Records
Map
Nearby Homes