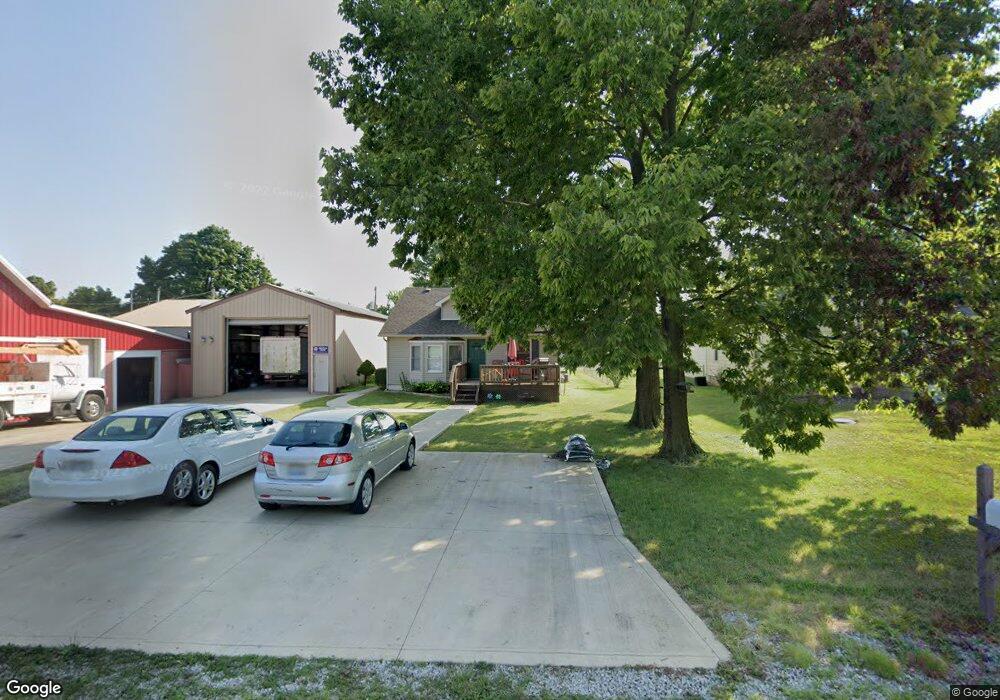
77 High St Carroll, OH 43112
Estimated Value: $167,000 - $305,930
4
Beds
3
Baths
2,556
Sq Ft
$91/Sq Ft
Est. Value
About This Home
This home is located at 77 High St, Carroll, OH 43112 and is currently estimated at $231,977, approximately $90 per square foot. 77 High St is a home located in Fairfield County with nearby schools including Bloom Carroll Primary School, Bloom Carroll Intermediate School, and Bloom-Carroll Middle School.
Ownership History
Date
Name
Owned For
Owner Type
Purchase Details
Closed on
Jun 12, 2015
Sold by
Bright Deborah L and Jpmorgan Chase Bank Na
Bought by
J Johnson Investments Llc
Current Estimated Value
Purchase Details
Closed on
Mar 1, 1990
Bought by
Bright Paul D
Create a Home Valuation Report for This Property
The Home Valuation Report is an in-depth analysis detailing your home's value as well as a comparison with similar homes in the area
Purchase History
| Date | Buyer | Sale Price | Title Company |
|---|---|---|---|
| J Johnson Investments Llc | $95,000 | Attorney | |
| Bright Paul D | $35,900 | -- |
Source: Public Records
Tax History
| Year | Tax Paid | Tax Assessment Tax Assessment Total Assessment is a certain percentage of the fair market value that is determined by local assessors to be the total taxable value of land and additions on the property. | Land | Improvement |
|---|---|---|---|---|
| 2025 | $5,334 | $63,180 | $17,380 | $45,800 |
| 2024 | $5,334 | $66,930 | $11,380 | $55,550 |
| 2023 | $2,957 | $66,930 | $11,380 | $55,550 |
| 2022 | $2,978 | $66,930 | $11,380 | $55,550 |
| 2021 | $2,013 | $44,410 | $9,480 | $34,930 |
| 2020 | $2,037 | $44,410 | $9,480 | $34,930 |
| 2019 | $2,045 | $44,410 | $9,480 | $34,930 |
| 2018 | $1,787 | $34,600 | $9,480 | $25,120 |
| 2017 | $1,678 | $39,870 | $9,480 | $30,390 |
| 2016 | $1,628 | $39,870 | $9,480 | $30,390 |
| 2015 | $1,466 | $35,890 | $9,480 | $26,410 |
| 2014 | $1,400 | $35,890 | $9,480 | $26,410 |
| 2013 | $1,400 | $35,890 | $9,480 | $26,410 |
Source: Public Records
Map
Nearby Homes
- 52 W Canal St
- 50 Market St
- 2155 Carroll-Southern Rd NW
- 5341 Carnes Rd NW
- 5699 Feldon Ct NW
- 3540 Carroll-Southern Rd NW
- 3510 Kauffman Rd NW
- 5840 High St NW
- 2291 Carroll-Southern Rd NW
- 2115 Lamb Rd NW
- 6103 Pickerington Rd
- 8322 Benson Rd
- 5560 Amanda Northern Rd NW
- 5840 Amanda Northern Rd NW
- 2270 Ginder Rd NW
- 7195 Alspach Rd NW
- 6625 Amanda Northern Rd
- 4315 Brook Rd NW
- 3355 Old Columbus Rd NW
- 5870 Brook Rd NW
Your Personal Tour Guide
Ask me questions while you tour the home.