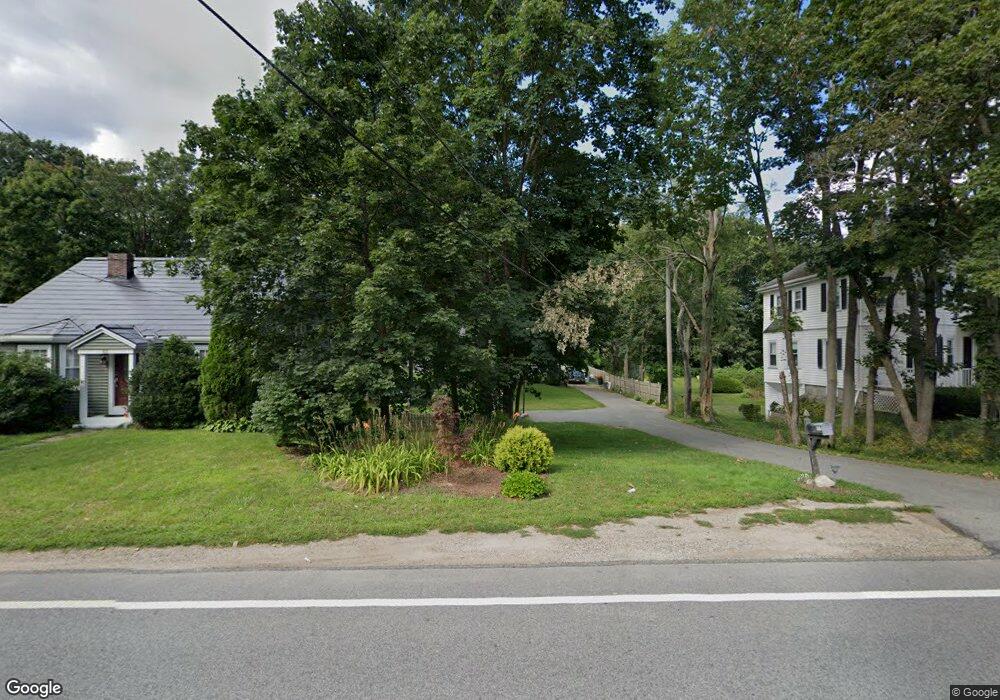
77 Hollis St South Weymouth, MA 02190
South Weymouth NeighborhoodEstimated Value: $603,000 - $739,000
4
Beds
2
Baths
1,610
Sq Ft
$416/Sq Ft
Est. Value
About This Home
This home is located at 77 Hollis St, South Weymouth, MA 02190 and is currently estimated at $670,005, approximately $416 per square foot. 77 Hollis St is a home located in Norfolk County with nearby schools including Thomas V Nash, Abigail Adams Middle School, and Weymouth Middle School Chapman.
Ownership History
Date
Name
Owned For
Owner Type
Purchase Details
Closed on
Apr 21, 2006
Sold by
Gorman Valerie G and Greene Valerie P
Bought by
Hayes Elizabeth C and Hayes Seth R
Current Estimated Value
Home Financials for this Owner
Home Financials are based on the most recent Mortgage that was taken out on this home.
Original Mortgage
$356,250
Outstanding Balance
$204,843
Interest Rate
6.37%
Mortgage Type
Purchase Money Mortgage
Estimated Equity
$465,162
Create a Home Valuation Report for This Property
The Home Valuation Report is an in-depth analysis detailing your home's value as well as a comparison with similar homes in the area
Home Values in the Area
Average Home Value in this Area
Purchase History
| Date | Buyer | Sale Price | Title Company |
|---|---|---|---|
| Hayes Elizabeth C | $375,000 | -- |
Source: Public Records
Mortgage History
| Date | Status | Borrower | Loan Amount |
|---|---|---|---|
| Open | Hayes Elizabeth C | $356,250 |
Source: Public Records
Tax History Compared to Growth
Tax History
| Year | Tax Paid | Tax Assessment Tax Assessment Total Assessment is a certain percentage of the fair market value that is determined by local assessors to be the total taxable value of land and additions on the property. | Land | Improvement |
|---|---|---|---|---|
| 2025 | $5,219 | $516,700 | $229,400 | $287,300 |
| 2024 | $4,992 | $486,100 | $218,500 | $267,600 |
| 2023 | $4,750 | $454,500 | $202,300 | $252,200 |
| 2022 | $4,691 | $409,300 | $187,300 | $222,000 |
| 2021 | $4,451 | $379,100 | $187,300 | $191,800 |
| 2020 | $4,340 | $364,100 | $187,300 | $176,800 |
| 2019 | $4,237 | $349,600 | $180,100 | $169,500 |
| 2018 | $4,143 | $331,400 | $171,500 | $159,900 |
| 2017 | $4,051 | $316,200 | $163,400 | $152,800 |
| 2016 | $3,917 | $306,000 | $157,100 | $148,900 |
| 2015 | $3,527 | $273,400 | $141,400 | $132,000 |
| 2014 | $3,606 | $271,100 | $146,200 | $124,900 |
Source: Public Records
Map
Nearby Homes
- 50 Hollis St
- 120 Randolph St
- 193 Randolph St
- 211 Randolph St
- 18 Fountain Ln Unit 2
- 11 Woodcrest Ct Unit 5
- 10 Woodcrest Ct Unit 4
- 7 Woodcrest Ct Unit 4
- 8 Woodcrest Ct Unit 4
- 55 Greentree Ln Unit 19
- 60 Greentree Ln Unit 38
- 24 Fisher Rd
- 45 Union St
- 68 Massapoag St Unit 7
- 16 Jay Rd
- 27 Park Ave
- 308 Forest St
- 102 White St
- 354 Tilden Commons Ln
- 25 Wales Ave