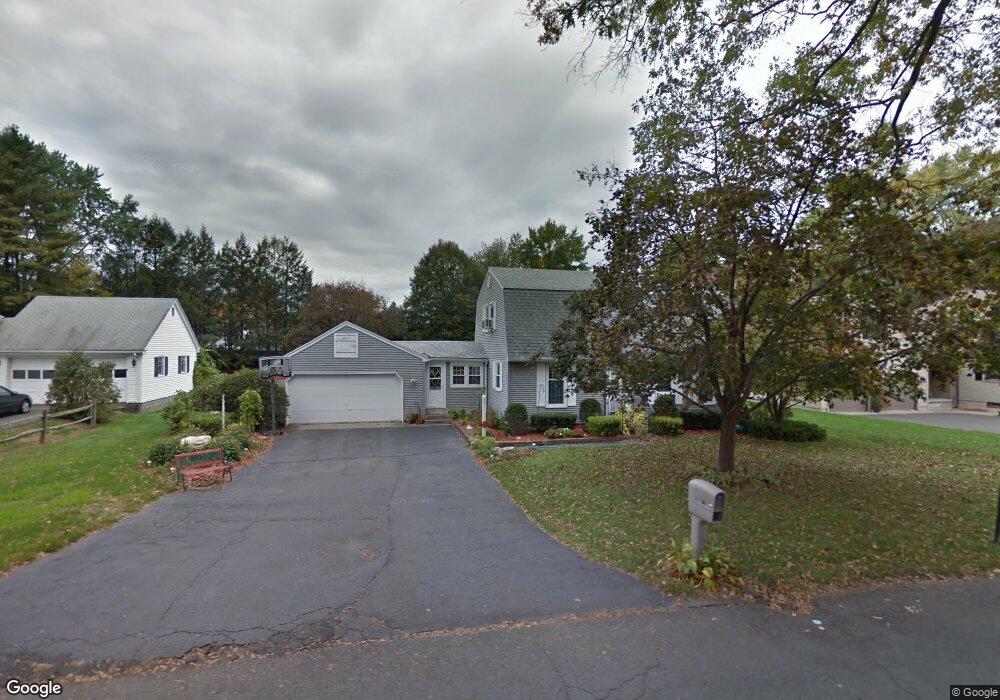
77 Hubbard St Westfield, MA 01085
Estimated Value: $337,000 - $447,000
3
Beds
2
Baths
1,632
Sq Ft
$236/Sq Ft
Est. Value
About This Home
This home is located at 77 Hubbard St, Westfield, MA 01085 and is currently estimated at $385,148, approximately $235 per square foot. 77 Hubbard St is a home located in Hampden County with nearby schools including Westfield High School and Saint Mary High School.
Ownership History
Date
Name
Owned For
Owner Type
Purchase Details
Closed on
Aug 13, 1998
Sold by
Est Thibualt Joseph W and Thibault Francis L
Bought by
Fedora Richard S and Fedora Christine A
Current Estimated Value
Home Financials for this Owner
Home Financials are based on the most recent Mortgage that was taken out on this home.
Original Mortgage
$95,000
Outstanding Balance
$19,853
Interest Rate
6.94%
Mortgage Type
Purchase Money Mortgage
Estimated Equity
$365,295
Create a Home Valuation Report for This Property
The Home Valuation Report is an in-depth analysis detailing your home's value as well as a comparison with similar homes in the area
Home Values in the Area
Average Home Value in this Area
Purchase History
| Date | Buyer | Sale Price | Title Company |
|---|---|---|---|
| Fedora Richard S | $138,000 | -- |
Source: Public Records
Mortgage History
| Date | Status | Borrower | Loan Amount |
|---|---|---|---|
| Open | Fedora Richard S | $95,000 |
Source: Public Records
Tax History
| Year | Tax Paid | Tax Assessment Tax Assessment Total Assessment is a certain percentage of the fair market value that is determined by local assessors to be the total taxable value of land and additions on the property. | Land | Improvement |
|---|---|---|---|---|
| 2025 | $4,639 | $305,600 | $101,500 | $204,100 |
| 2024 | $4,649 | $291,100 | $92,500 | $198,600 |
| 2023 | $4,464 | $262,900 | $88,100 | $174,800 |
| 2022 | $4,301 | $232,600 | $78,600 | $154,000 |
| 2021 | $2,020 | $220,900 | $74,200 | $146,700 |
| 2020 | $4,041 | $209,900 | $74,200 | $135,700 |
| 2019 | $3,946 | $200,600 | $70,400 | $130,200 |
| 2018 | $3,896 | $200,600 | $70,400 | $130,200 |
| 2017 | $3,810 | $196,200 | $71,500 | $124,700 |
| 2016 | $3,814 | $196,200 | $71,500 | $124,700 |
| 2015 | $3,625 | $195,500 | $71,500 | $124,000 |
| 2014 | $2,710 | $195,500 | $71,500 | $124,000 |
Source: Public Records
Map
Nearby Homes
- 113 Franklin St
- 42 Putnam Dr
- 19 Kellogg St
- 3 Belmont St
- 13 Green Ave
- 26 Washington St
- 324 Russell Rd Unit 204
- 324 Russell Rd Unit 109
- 324 Russell Rd Unit 101
- 163 Prospect Street Extension
- 12 Sibley Ave
- 44 Kensington Ave
- 60 Mill St
- 14 Loring Ln
- 76 Kane Brothers Cir
- 70 S Maple St
- 9 Montgomery St
- Lot 3 Montgomery
- 74 S Maple St
- 16 Squawfield Rd
- 97 Hubbard St
- 71 Hubbard St
- 80 Highland View St
- 101 Hubbard St
- 72 Highland View St
- 88 Highland View St
- 65 Hubbard St
- 64 Highland View St
- 59 Hubbard St
- 105 Hubbard St
- 77 Highland View St
- 85 Highland View St
- 71 Highland View St
- 104 Highland View St
- 107 Hubbard St
- 51 Hubbard St
- 95 Highland View St Unit 2
- 95 Highland View St
- 50 Highland View St
- 51 Highland View St
Your Personal Tour Guide
Ask me questions while you tour the home.