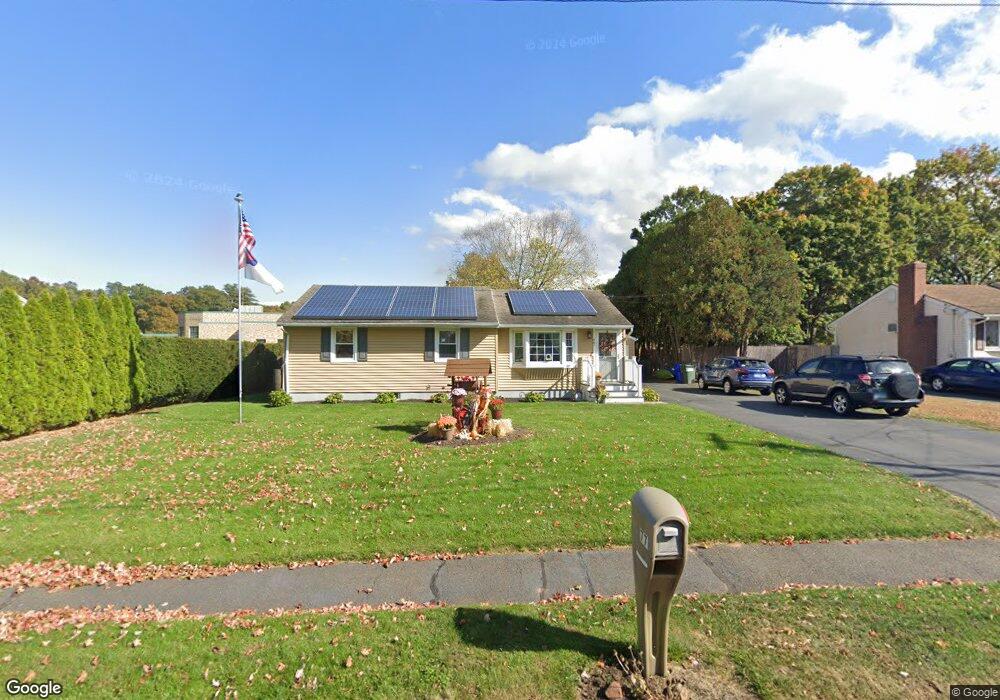
77 Johanna Cir Southington, CT 06489
East Southington NeighborhoodEstimated Value: $356,000 - $366,000
3
Beds
2
Baths
1,058
Sq Ft
$342/Sq Ft
Est. Value
About This Home
This home is located at 77 Johanna Cir, Southington, CT 06489 and is currently estimated at $361,390, approximately $341 per square foot. 77 Johanna Cir is a home located in Hartford County with nearby schools including Reuben E. Thalberg Elementary School, Joseph A. Depaolo Middle School, and Southington High School.
Ownership History
Date
Name
Owned For
Owner Type
Purchase Details
Closed on
Aug 5, 2021
Sold by
Clark Scott
Bought by
Clark Eva and Clark Scott
Current Estimated Value
Home Financials for this Owner
Home Financials are based on the most recent Mortgage that was taken out on this home.
Original Mortgage
$151,700
Outstanding Balance
$114,447
Interest Rate
2.2%
Mortgage Type
Stand Alone Refi Refinance Of Original Loan
Estimated Equity
$246,943
Purchase Details
Closed on
May 11, 2012
Sold by
Clark Eva
Bought by
Clark Scott
Home Financials for this Owner
Home Financials are based on the most recent Mortgage that was taken out on this home.
Original Mortgage
$177,255
Interest Rate
4.12%
Mortgage Type
FHA
Purchase Details
Closed on
Jan 31, 2001
Sold by
Lambins Jon D and Lambins Kelli J
Bought by
Clark Scott and Clark Eva
Create a Home Valuation Report for This Property
The Home Valuation Report is an in-depth analysis detailing your home's value as well as a comparison with similar homes in the area
Home Values in the Area
Average Home Value in this Area
Purchase History
| Date | Buyer | Sale Price | Title Company |
|---|---|---|---|
| Clark Eva | -- | None Available | |
| Clark Eva | -- | None Available | |
| Clark Scott | -- | -- | |
| Clark Scott | $130,000 | -- | |
| Clark Scott | -- | -- | |
| Clark Scott | $130,000 | -- |
Source: Public Records
Mortgage History
| Date | Status | Borrower | Loan Amount |
|---|---|---|---|
| Open | Clark Eva | $151,700 | |
| Previous Owner | Clark Scott | $177,255 |
Source: Public Records
Tax History Compared to Growth
Tax History
| Year | Tax Paid | Tax Assessment Tax Assessment Total Assessment is a certain percentage of the fair market value that is determined by local assessors to be the total taxable value of land and additions on the property. | Land | Improvement |
|---|---|---|---|---|
| 2025 | $4,503 | $135,580 | $55,210 | $80,370 |
| 2024 | $4,263 | $135,580 | $55,210 | $80,370 |
| 2023 | $4,116 | $135,580 | $55,210 | $80,370 |
| 2022 | $3,949 | $135,580 | $55,210 | $80,370 |
| 2021 | $3,936 | $135,580 | $55,210 | $80,370 |
| 2020 | $3,754 | $122,570 | $56,340 | $66,230 |
| 2019 | $3,756 | $122,570 | $56,340 | $66,230 |
| 2018 | $3,736 | $122,570 | $56,340 | $66,230 |
| 2017 | $3,736 | $122,570 | $56,340 | $66,230 |
| 2016 | $3,633 | $122,570 | $56,340 | $66,230 |
| 2015 | $3,462 | $118,820 | $53,660 | $65,160 |
| 2014 | $3,370 | $118,820 | $53,660 | $65,160 |
Source: Public Records
Map
Nearby Homes
- 46 Rethal St
- 32 Minthal Dr
- 452 East St
- 228 Pattonwood Dr
- 15 Mountain View Dr
- 12 Oakland St
- 26 Mountain View Dr
- 27 Brookside Dr
- 45 Quail Hollow Dr
- 16 Brookside Dr
- 10 Terra Rd
- 10 Meadow Rd
- 7 Meadow Rd
- 309 East St Unit 10
- 1198 Flanders Rd
- 81 Laning St
- 189 Redstone Hill Rd Unit 7
- 300 Captain Lewis Dr
- 320 Captain Lewis Dr
- 300 & 320 Captain Lewis Dr