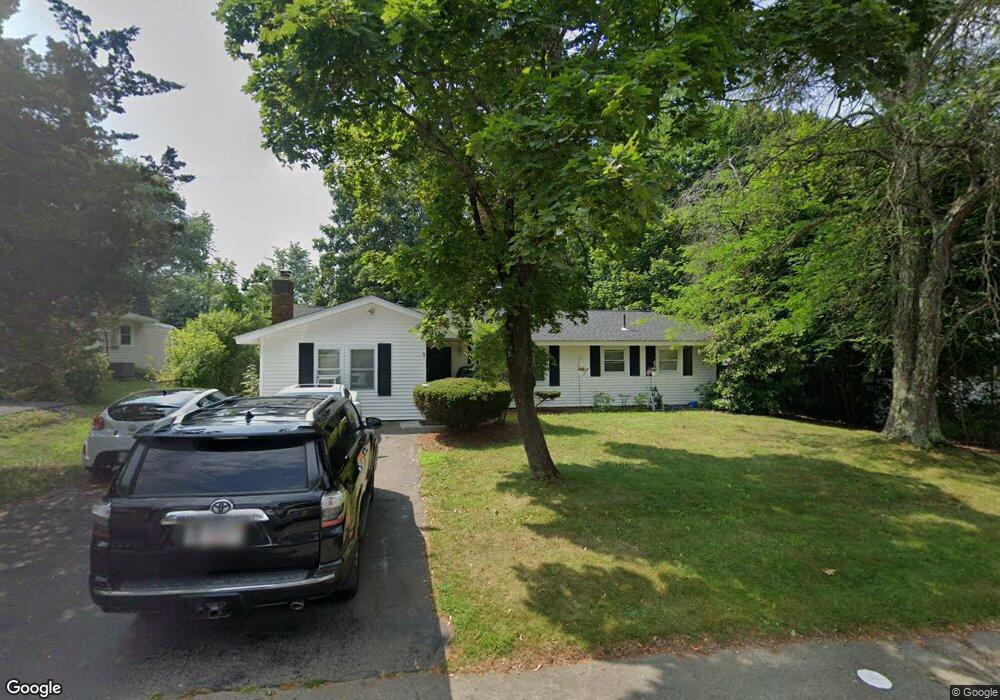
77 Kathleen Rd Brockton, MA 02302
Estimated Value: $485,872 - $501,000
3
Beds
1
Bath
1,376
Sq Ft
$357/Sq Ft
Est. Value
About This Home
This home is located at 77 Kathleen Rd, Brockton, MA 02302 and is currently estimated at $490,968, approximately $356 per square foot. 77 Kathleen Rd is a home located in Plymouth County with nearby schools including Brookfield Elementary School, Mary E. Baker Elementary School, and Downey Elementary School.
Ownership History
Date
Name
Owned For
Owner Type
Purchase Details
Closed on
Oct 29, 2009
Sold by
B & C Rt
Bought by
Craig Robert C and Elms Colleen M
Current Estimated Value
Home Financials for this Owner
Home Financials are based on the most recent Mortgage that was taken out on this home.
Original Mortgage
$205,214
Outstanding Balance
$134,407
Interest Rate
5.06%
Mortgage Type
Purchase Money Mortgage
Estimated Equity
$356,561
Purchase Details
Closed on
May 12, 2009
Sold by
Countrywide Home Loans
Bought by
B & C Rt
Purchase Details
Closed on
Feb 2, 2009
Sold by
Vara Ronalda K
Bought by
Bank Of New York
Purchase Details
Closed on
Jan 12, 2005
Sold by
Kathleen Vara T
Bought by
Vara Ronalda K
Create a Home Valuation Report for This Property
The Home Valuation Report is an in-depth analysis detailing your home's value as well as a comparison with similar homes in the area
Home Values in the Area
Average Home Value in this Area
Purchase History
| Date | Buyer | Sale Price | Title Company |
|---|---|---|---|
| Craig Robert C | $209,000 | -- | |
| B & C Rt | $80,000 | -- | |
| Bank Of New York | $206,462 | -- | |
| Vara Ronalda K | -- | -- |
Source: Public Records
Mortgage History
| Date | Status | Borrower | Loan Amount |
|---|---|---|---|
| Open | Craig Robert C | $205,214 |
Source: Public Records
Tax History Compared to Growth
Tax History
| Year | Tax Paid | Tax Assessment Tax Assessment Total Assessment is a certain percentage of the fair market value that is determined by local assessors to be the total taxable value of land and additions on the property. | Land | Improvement |
|---|---|---|---|---|
| 2025 | $4,906 | $405,100 | $150,600 | $254,500 |
| 2024 | $4,845 | $403,100 | $150,600 | $252,500 |
| 2023 | $4,747 | $365,700 | $116,000 | $249,700 |
| 2022 | $4,572 | $327,300 | $105,600 | $221,700 |
| 2021 | $4,224 | $291,300 | $98,500 | $192,800 |
| 2020 | $4,242 | $280,000 | $94,400 | $185,600 |
| 2019 | $3,765 | $242,300 | $88,400 | $153,900 |
| 2018 | $3,708 | $230,900 | $88,400 | $142,500 |
| 2017 | $3,431 | $213,100 | $88,400 | $124,700 |
| 2016 | $3,295 | $189,800 | $84,600 | $105,200 |
| 2015 | $3,249 | $179,000 | $84,600 | $94,400 |
| 2014 | $3,225 | $177,900 | $84,600 | $93,300 |
Source: Public Records
Map
Nearby Homes