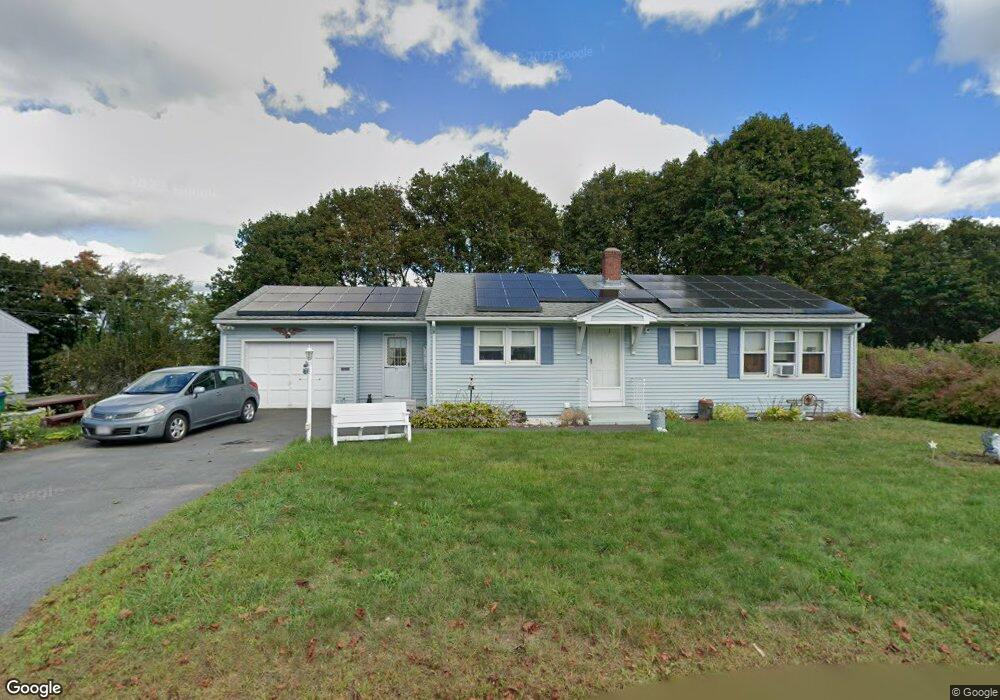
77 Krysiak Ave Fitchburg, MA 01420
South Fitchburg NeighborhoodEstimated Value: $361,000 - $423,006
2
Beds
2
Baths
1,120
Sq Ft
$354/Sq Ft
Est. Value
About This Home
This home is located at 77 Krysiak Ave, Fitchburg, MA 01420 and is currently estimated at $396,002, approximately $353 per square foot. 77 Krysiak Ave is a home located in Worcester County with nearby schools including South Street Elementary School, Crocker Elementary School, and Reingold Elementary School.
Ownership History
Date
Name
Owned For
Owner Type
Purchase Details
Closed on
Sep 15, 2020
Sold by
Parrott James J and Parrott Joshua
Bought by
77 Krysiak Avenue Rt and Parrott
Current Estimated Value
Purchase Details
Closed on
Aug 13, 2013
Sold by
Parrott Robert D Est and Parrott-Boyd
Bought by
Parrott Joshua and Parrott James J
Purchase Details
Closed on
Jul 27, 2010
Sold by
Parrott-Boyd Mary Ann
Bought by
Parrott Robert D
Create a Home Valuation Report for This Property
The Home Valuation Report is an in-depth analysis detailing your home's value as well as a comparison with similar homes in the area
Home Values in the Area
Average Home Value in this Area
Purchase History
| Date | Buyer | Sale Price | Title Company |
|---|---|---|---|
| 77 Krysiak Avenue Rt | -- | None Available | |
| Parrott Joshua | -- | -- | |
| Parrott Robert D | -- | -- |
Source: Public Records
Tax History Compared to Growth
Tax History
| Year | Tax Paid | Tax Assessment Tax Assessment Total Assessment is a certain percentage of the fair market value that is determined by local assessors to be the total taxable value of land and additions on the property. | Land | Improvement |
|---|---|---|---|---|
| 2025 | $45 | $334,000 | $109,400 | $224,600 |
| 2024 | $4,499 | $303,800 | $87,300 | $216,500 |
| 2023 | $4,450 | $277,800 | $77,600 | $200,200 |
| 2022 | $4,174 | $237,000 | $74,800 | $162,200 |
| 2021 | $4,088 | $214,800 | $66,500 | $148,300 |
| 2020 | $3,944 | $200,100 | $61,000 | $139,100 |
| 2019 | $3,920 | $191,300 | $73,500 | $117,800 |
| 2018 | $3,683 | $175,300 | $67,900 | $107,400 |
| 2017 | $3,548 | $165,100 | $63,800 | $101,300 |
| 2016 | $3,384 | $159,400 | $62,400 | $97,000 |
| 2015 | $3,238 | $156,600 | $61,000 | $95,600 |
| 2014 | $3,042 | $153,400 | $58,200 | $95,200 |
Source: Public Records
Map
Nearby Homes
- 2 Arden Mills Way Unit 2210
- 2 Arden Mills Way Unit 2102
- 35 Bemis Rd
- 31 Bemis Rd
- 55 Smith St
- 62 Hancock St
- 19 Mount Carmel St
- 55 Canton St
- 20 Clyde St
- 90 Albee St
- 11 Doane St
- 0 Summer St
- 1220 Water St
- 381 Summer St
- 535 South St Unit 4-2A
- 535 South St Unit 14-2A
- 535 South St Unit 11-2A
- 32 Birch St
- 156 Summer St
- 20 Pleasantview Ave