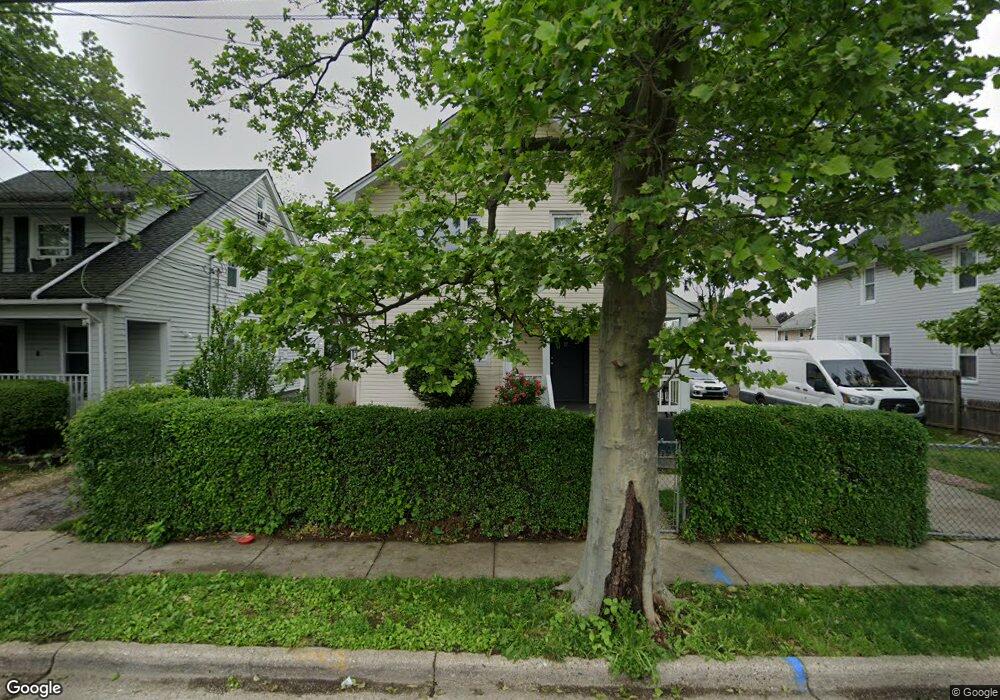
77 Lent Ave Unit 2 Hempstead, NY 11550
Estimated Value: $629,000 - $679,080
1
Bed
1
Bath
1,820
Sq Ft
$359/Sq Ft
Est. Value
About This Home
This home is located at 77 Lent Ave Unit 2, Hempstead, NY 11550 and is currently estimated at $654,040, approximately $359 per square foot. 77 Lent Ave Unit 2 is a home located in Nassau County with nearby schools including Roosevelt Children's Academy, St Joseph Elementary School, and Crescent School.
Ownership History
Date
Name
Owned For
Owner Type
Purchase Details
Closed on
Mar 15, 2019
Sold by
Persaud Savita and Persaud Chitranjan
Bought by
Persaud Savita
Current Estimated Value
Purchase Details
Closed on
Sep 18, 2018
Sold by
Cedeno Mabel M
Bought by
Persaud Savita and Persaud Chitranjan
Home Financials for this Owner
Home Financials are based on the most recent Mortgage that was taken out on this home.
Original Mortgage
$343,464
Outstanding Balance
$301,287
Interest Rate
5.25%
Mortgage Type
FHA
Estimated Equity
$352,753
Purchase Details
Closed on
Aug 15, 2014
Sold by
Paiva Florinda
Bought by
Cedeno Mabel M
Purchase Details
Closed on
Jan 13, 2004
Sold by
Siidmarc Maurice
Bought by
Paiva Florinda
Purchase Details
Closed on
Oct 24, 2002
Sold by
Siidmarc Maurice
Create a Home Valuation Report for This Property
The Home Valuation Report is an in-depth analysis detailing your home's value as well as a comparison with similar homes in the area
Home Values in the Area
Average Home Value in this Area
Purchase History
| Date | Buyer | Sale Price | Title Company |
|---|---|---|---|
| Persaud Savita | -- | Commonwealth Land Title | |
| Persaud Savita | -- | Commonwealth Land Title | |
| Persaud Savita | -- | Commonwealth Land Title | |
| Persaud Savita | $349,800 | None Available | |
| Persaud Savita | $349,800 | None Available | |
| Persaud Savita | $349,800 | None Available | |
| Cedeno Mabel M | $200 | -- | |
| Cedeno Mabel M | $200 | -- | |
| Cedeno Mabel M | $200 | -- | |
| Paiva Florinda | $315,000 | -- | |
| Paiva Florinda | $315,000 | -- | |
| -- | -- | -- | |
| -- | -- | -- |
Source: Public Records
Mortgage History
| Date | Status | Borrower | Loan Amount |
|---|---|---|---|
| Open | Persaud Savita | $343,464 | |
| Closed | Persaud Savita | $343,464 |
Source: Public Records
Tax History
| Year | Tax Paid | Tax Assessment Tax Assessment Total Assessment is a certain percentage of the fair market value that is determined by local assessors to be the total taxable value of land and additions on the property. | Land | Improvement |
|---|---|---|---|---|
| 2025 | $8,857 | $349 | $123 | $226 |
| 2024 | $967 | $349 | $123 | $226 |
| 2023 | $9,862 | $349 | $123 | $226 |
| 2022 | $9,862 | $349 | $123 | $226 |
| 2021 | $15,641 | $338 | $119 | $219 |
| 2020 | $12,051 | $760 | $416 | $344 |
| 2019 | $1,474 | $760 | $416 | $344 |
| 2018 | $1,514 | $760 | $0 | $0 |
| 2017 | $8,484 | $760 | $416 | $344 |
| 2016 | $9,814 | $760 | $416 | $344 |
| 2015 | $1,273 | $760 | $416 | $344 |
| 2014 | $1,273 | $760 | $416 | $344 |
| 2013 | $1,178 | $760 | $416 | $344 |
Source: Public Records
Map
Nearby Homes
- 76 Van Cott Ave
- 12 Lafayette Ave
- 269 E Columbia St
- 93 Princeton St
- 27 Midwood St
- 113 Stewart Ave
- 118 Morrell St
- 297 E Columbia St
- 69 Hewlett St
- 79 Union Place
- 248 Main St
- 140 Amherst St
- 32 Stowe Place
- 40 Meadow St
- 260 Yale St
- 361 E Columbia St
- 144 N Franklin St
- 133 Wellington St
- 200 Princeton St
- 199 Wellesley St
Your Personal Tour Guide
Ask me questions while you tour the home.