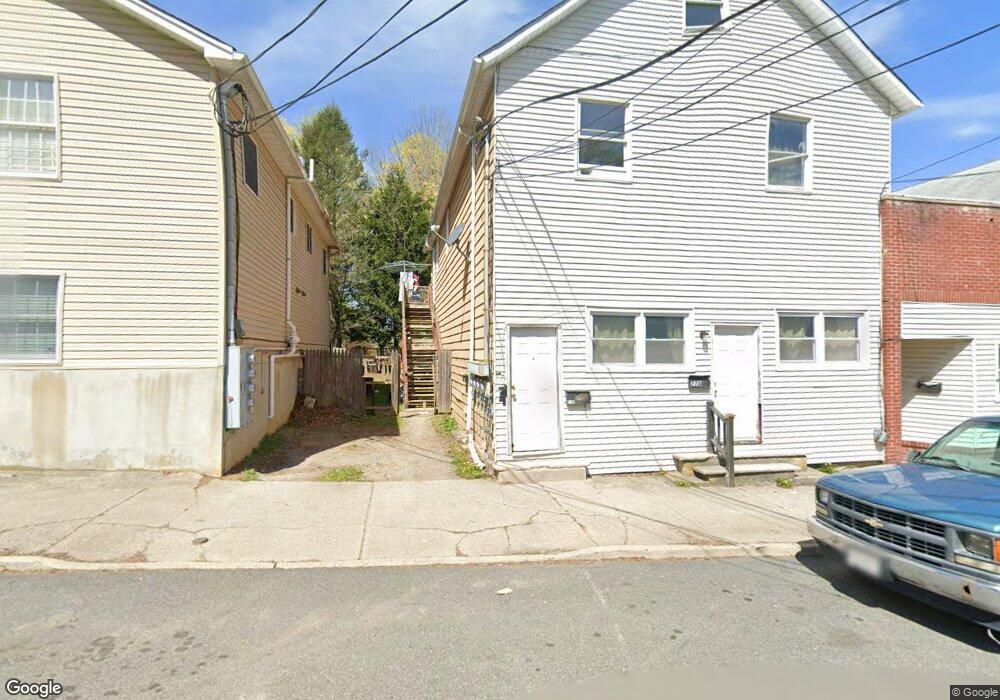
77 Main St Unit 79 Franklin, NJ 07416
Estimated Value: $445,250 - $557,000
Studio
--
Bath
2,883
Sq Ft
$178/Sq Ft
Est. Value
About This Home
This home is located at 77 Main St Unit 79, Franklin, NJ 07416 and is currently estimated at $511,813, approximately $177 per square foot. 77 Main St Unit 79 is a home located in Sussex County with nearby schools including Franklin Elementary School, Wallkill Valley Regional High School, and Immaculate Conception Regional School.
Ownership History
Date
Name
Owned For
Owner Type
Purchase Details
Closed on
Jun 24, 2004
Sold by
Holden David W and Holden Joanne
Bought by
Galvin Daniel T and Galvin Stacy
Current Estimated Value
Home Financials for this Owner
Home Financials are based on the most recent Mortgage that was taken out on this home.
Original Mortgage
$228,000
Outstanding Balance
$82,995
Interest Rate
2.25%
Mortgage Type
Purchase Money Mortgage
Estimated Equity
$428,818
Purchase Details
Closed on
Feb 4, 2003
Sold by
Nano Aries
Bought by
Holden David W and Holden Joanne
Home Financials for this Owner
Home Financials are based on the most recent Mortgage that was taken out on this home.
Original Mortgage
$143,000
Interest Rate
5.95%
Mortgage Type
Stand Alone First
Purchase Details
Closed on
Mar 12, 1997
Sold by
Evans Christian E
Bought by
Nano Aries
Home Financials for this Owner
Home Financials are based on the most recent Mortgage that was taken out on this home.
Original Mortgage
$143,150
Interest Rate
7.59%
Mortgage Type
FHA
Create a Home Valuation Report for This Property
The Home Valuation Report is an in-depth analysis detailing your home's value as well as a comparison with similar homes in the area
Home Values in the Area
Average Home Value in this Area
Purchase History
| Date | Buyer | Sale Price | Title Company |
|---|---|---|---|
| Galvin Daniel T | $285,000 | Cornerstone Abstract & Title | |
| Holden David W | $182,000 | -- | |
| Nano Aries | $150,000 | -- |
Source: Public Records
Mortgage History
| Date | Status | Borrower | Loan Amount |
|---|---|---|---|
| Open | Galvin Daniel T | $228,000 | |
| Previous Owner | Holden David W | $143,000 | |
| Previous Owner | Nano Aries | $143,150 |
Source: Public Records
Tax History
| Year | Tax Paid | Tax Assessment Tax Assessment Total Assessment is a certain percentage of the fair market value that is determined by local assessors to be the total taxable value of land and additions on the property. | Land | Improvement |
|---|---|---|---|---|
| 2025 | $9,140 | $468,500 | $95,600 | $372,900 |
| 2024 | $9,150 | $344,400 | $76,900 | $267,500 |
Source: Public Records
Map
Nearby Homes
- 26 Wyker Rd Unit A
- 52 High St
- 62 High St
- 65 Buckwheat Rd
- 112 Scott Rd
- 66 Nestor St
- 19 John Wilton St Unit 21
- 35 Liberty Ln Unit Y2
- 63 Liberty Ln Unit 7
- 20 High Point CI
- 149 Maple Rd
- 172 Maple Rd
- 580 State Rt 23
- 140 Wheatsworth Rd
- 17 Emerald Dr
- 18 Emerald Dr
- 7 Emerald Dr
- 6 Andre Ct
- 142 Wheatsworth Rd
- 6 Mulberry St
- 81-83 Main St
- 81 Main St
- 75 Main St
- 75 Main St
- 76 Main St
- 85 Main St Unit 87
- 85-87 Main St
- 78 Main St
- 74 Main St
- 80-82 Main St Unit 3
- 80-82 Main St
- 80 Main St Unit 2
- 80 Main St
- 80 Main St Unit 3
- 89 Main St
- 84-86 Main St
- 84 84-86 Main St Unit B
- 84 84-86 Main St Unit A
- 84 Main St Unit F
- 84 Main St Unit B
Your Personal Tour Guide
Ask me questions while you tour the home.