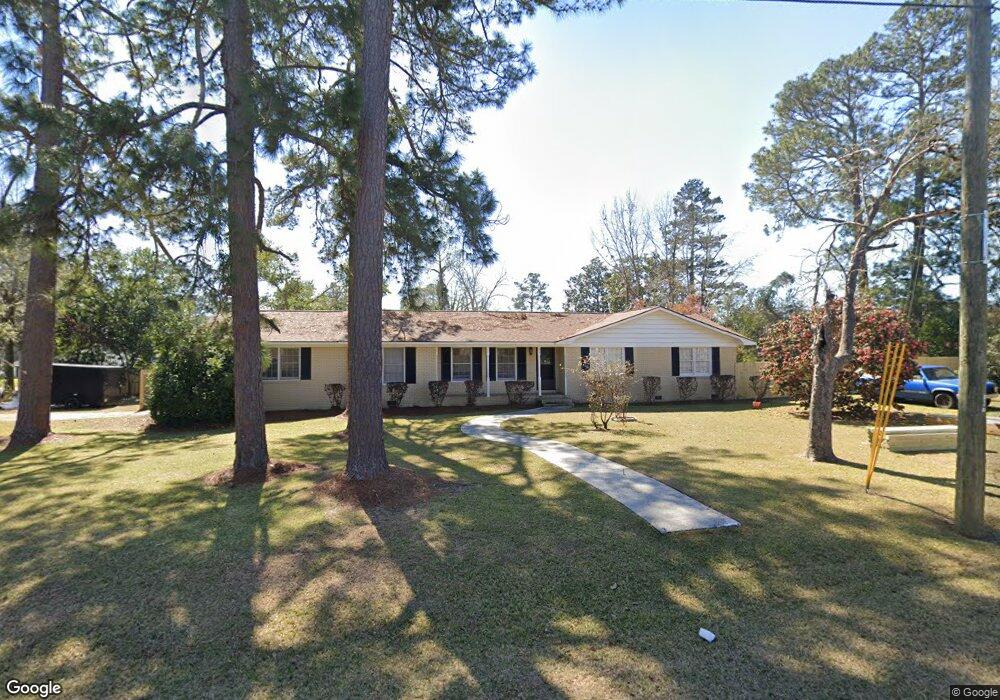
77 Main St Morven, GA 31638
Estimated Value: $114,000 - $196,000
3
Beds
2
Baths
1,757
Sq Ft
$97/Sq Ft
Est. Value
About This Home
This home is located at 77 Main St, Morven, GA 31638 and is currently estimated at $171,091, approximately $97 per square foot. 77 Main St is a home located in Brooks County with nearby schools including North Brooks Elementary School.
Ownership History
Date
Name
Owned For
Owner Type
Purchase Details
Closed on
Jan 30, 2023
Sold by
Yates Sandy
Bought by
Bender Martha Abigail and Bender Steven Anthony
Current Estimated Value
Home Financials for this Owner
Home Financials are based on the most recent Mortgage that was taken out on this home.
Original Mortgage
$132,275
Outstanding Balance
$128,021
Interest Rate
6.75%
Mortgage Type
FHA
Estimated Equity
$43,070
Purchase Details
Closed on
Feb 26, 2005
Sold by
Rentz Gary
Bought by
Rentz Sandra and Rentz Gary
Home Financials for this Owner
Home Financials are based on the most recent Mortgage that was taken out on this home.
Original Mortgage
$135,350
Interest Rate
8.63%
Mortgage Type
New Conventional
Purchase Details
Closed on
Sep 14, 1990
Sold by
Barnes Martha H and Harris Eulah
Bought by
Rentz Gary and Rentz Sandy
Purchase Details
Closed on
Jul 19, 1985
Sold by
Harris B T
Bought by
Barnes Martha H and Harris Eulah
Purchase Details
Closed on
Jan 2, 1924
Bought by
Harris B T
Create a Home Valuation Report for This Property
The Home Valuation Report is an in-depth analysis detailing your home's value as well as a comparison with similar homes in the area
Purchase History
| Date | Buyer | Sale Price | Title Company |
|---|---|---|---|
| Bender Martha Abigail | $165,000 | -- | |
| Rentz Sandra | -- | -- | |
| Rentz Gary | $53,000 | -- | |
| Barnes Martha H | -- | -- | |
| Harris B T | -- | -- |
Source: Public Records
Mortgage History
| Date | Status | Borrower | Loan Amount |
|---|---|---|---|
| Open | Bender Martha Abigail | $132,275 | |
| Previous Owner | Rentz Sandra | $135,350 |
Source: Public Records
Tax History
| Year | Tax Paid | Tax Assessment Tax Assessment Total Assessment is a certain percentage of the fair market value that is determined by local assessors to be the total taxable value of land and additions on the property. | Land | Improvement |
|---|---|---|---|---|
| 2025 | $2,688 | $67,336 | $3,560 | $63,776 |
| 2024 | $2,638 | $67,336 | $3,560 | $63,776 |
| 2023 | $2,604 | $65,096 | $3,560 | $61,536 |
| 2022 | $2,482 | $60,496 | $3,800 | $56,696 |
| 2021 | $1,937 | $45,536 | $1,880 | $43,656 |
| 2020 | $1,874 | $45,536 | $1,880 | $43,656 |
| 2019 | $1,608 | $37,332 | $1,800 | $35,532 |
| 2018 | $1,660 | $38,252 | $2,160 | $36,092 |
| 2017 | $1,573 | $36,172 | $2,160 | $34,012 |
| 2016 | $1,550 | $36,732 | $2,160 | $34,572 |
| 2015 | -- | $36,372 | $2,160 | $34,212 |
| 2014 | -- | $36,892 | $2,160 | $34,732 |
| 2013 | -- | $36,892 | $2,160 | $34,732 |
Source: Public Records
Map
Nearby Homes
- 11432 Adel Hwy
- 165 Fletcher St
- 91 Azalea St
- 95 Azalea St
- 1829 Blease Rd
- 8170 Ga Highway 122 W
- 4386 Studstill Rd
- 8200 Georgia 122
- 5823 Snake Nation Rd
- 2430 Spain Rd
- 7959 Old Valdosta Rd N
- 2075 Ellenberg Rd
- 8009 Webb Rd N
- 1019 Fodie Rd
- 7301 Shadow Creek Dr
- 7280 Mill Ridge Dr
- 7279 Tillman Branch Rd
- 7325 Wind Chase Dr
- 7305 Wind Chase Dr
- 832 Ramblin Rd
Your Personal Tour Guide
Ask me questions while you tour the home.