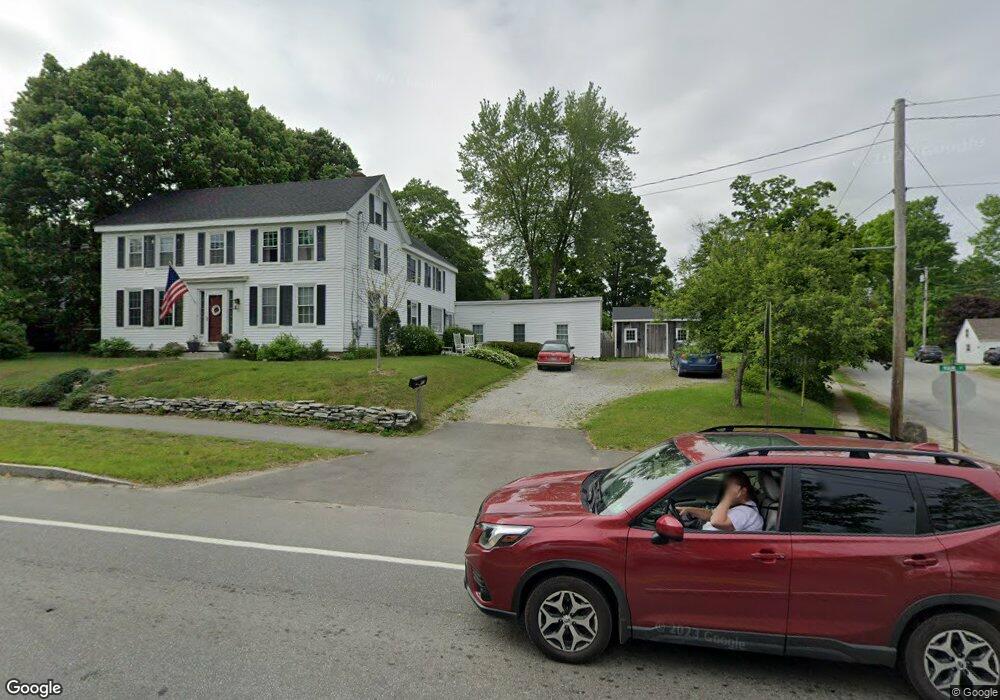
77 Main St Thomaston, ME 04861
Estimated Value: $445,000 - $543,000
4
Beds
3
Baths
3,350
Sq Ft
$144/Sq Ft
Est. Value
About This Home
This home is located at 77 Main St, Thomaston, ME 04861 and is currently estimated at $480,824, approximately $143 per square foot. 77 Main St is a home located in Knox County with nearby schools including Thomaston Grammar School, Oceanside High School East, and Midcoast STEAM Microschool.
Ownership History
Date
Name
Owned For
Owner Type
Purchase Details
Closed on
Aug 27, 2021
Sold by
Blood Michael G and Maxwell-Blood Brandi
Bought by
Silverton Emma B and Silverton Alexander J
Current Estimated Value
Home Financials for this Owner
Home Financials are based on the most recent Mortgage that was taken out on this home.
Original Mortgage
$252,747
Outstanding Balance
$229,981
Interest Rate
2.8%
Mortgage Type
FHA
Estimated Equity
$250,843
Purchase Details
Closed on
May 4, 2005
Sold by
Willis Linda C and Willis Robert C
Bought by
Blood Michael G and Maxwell Brandi L
Home Financials for this Owner
Home Financials are based on the most recent Mortgage that was taken out on this home.
Original Mortgage
$224,000
Interest Rate
6.01%
Mortgage Type
Commercial
Create a Home Valuation Report for This Property
The Home Valuation Report is an in-depth analysis detailing your home's value as well as a comparison with similar homes in the area
Home Values in the Area
Average Home Value in this Area
Purchase History
| Date | Buyer | Sale Price | Title Company |
|---|---|---|---|
| Silverton Emma B | -- | None Available | |
| Blood Michael G | -- | -- |
Source: Public Records
Mortgage History
| Date | Status | Borrower | Loan Amount |
|---|---|---|---|
| Open | Silverton Emma B | $252,747 | |
| Previous Owner | Blood Michael G | $224,000 | |
| Previous Owner | Blood Michael G | $14,000 |
Source: Public Records
Tax History
| Year | Tax Paid | Tax Assessment Tax Assessment Total Assessment is a certain percentage of the fair market value that is determined by local assessors to be the total taxable value of land and additions on the property. | Land | Improvement |
|---|---|---|---|---|
| 2024 | $6,488 | $324,400 | $109,000 | $215,400 |
| 2023 | $6,130 | $324,357 | $109,000 | $215,357 |
| 2022 | $5,673 | $260,001 | $109,000 | $151,001 |
| 2021 | $5,598 | $260,001 | $109,000 | $151,001 |
| 2020 | $5,728 | $260,001 | $109,000 | $151,001 |
| 2019 | $5,806 | $260,001 | $109,000 | $151,001 |
| 2018 | $5,442 | $260,001 | $109,000 | $151,001 |
| 2017 | $5,044 | $260,001 | $109,000 | $151,001 |
| 2016 | $4,857 | $260,001 | $109,000 | $151,001 |
| 2015 | $4,721 | $261,821 | $109,000 | $152,821 |
| 2014 | $4,573 | $274,821 | $122,000 | $152,821 |
| 2013 | $4,907 | $293,115 | $122,000 | $171,115 |
Source: Public Records
Map
Nearby Homes
- 52 Main St
- 27 Lawrence Ave
- 145 Main St
- 40 Beechwood St
- 76 Fish St
- 102 Beechwood St
- 104 Beechwood St
- 56 Booker St
- 482 Main St
- 36 Sunrise Terrace
- 92 Maurice Ave
- 26 Clark St
- Lot 151 Dunbar Rd
- 52 Ledge Rd
- 0 Branch Brook Rd
- 000 Atlantic Highway Map 4 Lot 24
- 580 Saint George Rd
- 46 Cedar Dr
- 360 Cushing Rd
- 29 Punkin Hill Rd
Your Personal Tour Guide
Ask me questions while you tour the home.