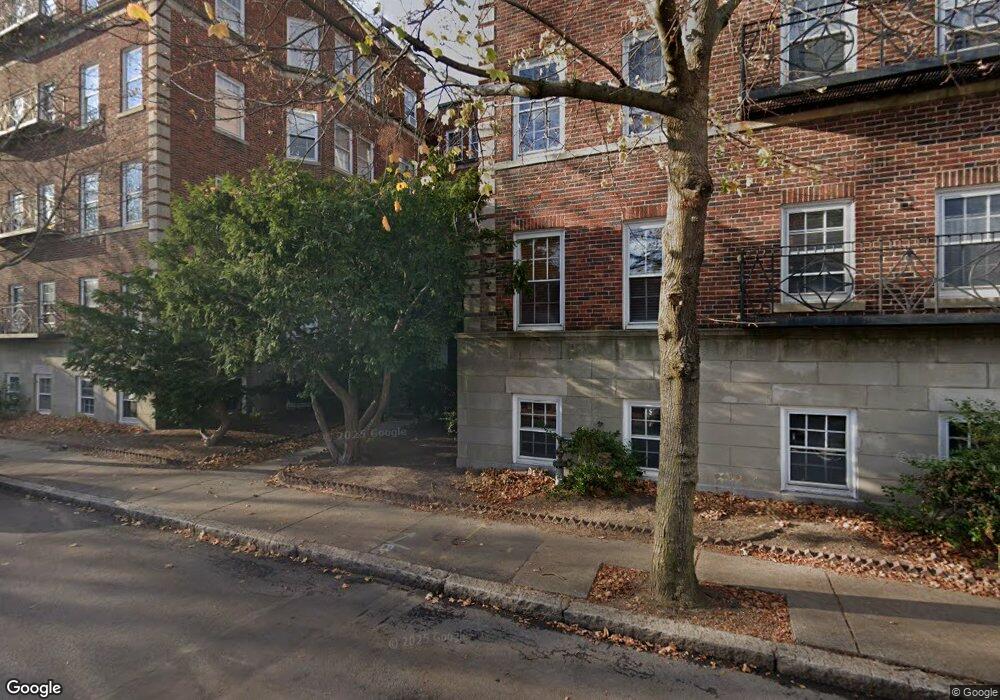
77 Martin St Unit 35 Cambridge, MA 02138
Neighborhood Nine NeighborhoodEstimated Value: $662,000 - $784,000
2
Beds
1
Bath
813
Sq Ft
$883/Sq Ft
Est. Value
About This Home
This home is located at 77 Martin St Unit 35, Cambridge, MA 02138 and is currently estimated at $718,021, approximately $883 per square foot. 77 Martin St Unit 35 is a home located in Middlesex County with nearby schools including St Peter School, Cambridge Montessori School, and Cambridge Friends School.
Ownership History
Date
Name
Owned For
Owner Type
Purchase Details
Closed on
Aug 8, 2012
Sold by
Lowe Nicholas J and Lowe Pamela
Bought by
Nichola Lowe Ret
Current Estimated Value
Purchase Details
Closed on
Jun 24, 1997
Sold by
Harvey Cynthia and Harvey Judith
Bought by
Lowe Nicholas J and Lowe Pamela
Home Financials for this Owner
Home Financials are based on the most recent Mortgage that was taken out on this home.
Original Mortgage
$135,920
Interest Rate
7.87%
Mortgage Type
Purchase Money Mortgage
Purchase Details
Closed on
Sep 26, 1991
Sold by
List Ola A
Bought by
Harvey Harvey Cynthia Cynthia and Judith Harvey
Home Financials for this Owner
Home Financials are based on the most recent Mortgage that was taken out on this home.
Original Mortgage
$76,250
Interest Rate
9.1%
Mortgage Type
Purchase Money Mortgage
Purchase Details
Closed on
Aug 30, 1989
Sold by
Volkman Janet G
Bought by
Waters Mary
Create a Home Valuation Report for This Property
The Home Valuation Report is an in-depth analysis detailing your home's value as well as a comparison with similar homes in the area
Home Values in the Area
Average Home Value in this Area
Purchase History
| Date | Buyer | Sale Price | Title Company |
|---|---|---|---|
| Nichola Lowe Ret | -- | -- | |
| Lowe Nicholas J | $169,900 | -- | |
| Harvey Harvey Cynthia Cynthia | $152,500 | -- | |
| Waters Mary | $150,000 | -- |
Source: Public Records
Mortgage History
| Date | Status | Borrower | Loan Amount |
|---|---|---|---|
| Previous Owner | Waters Mary | $135,920 | |
| Previous Owner | Waters Mary | $76,250 |
Source: Public Records
Tax History Compared to Growth
Tax History
| Year | Tax Paid | Tax Assessment Tax Assessment Total Assessment is a certain percentage of the fair market value that is determined by local assessors to be the total taxable value of land and additions on the property. | Land | Improvement |
|---|---|---|---|---|
| 2025 | $3,777 | $594,800 | $0 | $594,800 |
| 2024 | $3,445 | $582,000 | $0 | $582,000 |
| 2023 | $3,393 | $579,000 | $0 | $579,000 |
| 2022 | $3,373 | $582,100 | $0 | $582,100 |
| 2021 | $3,373 | $576,600 | $0 | $576,600 |
| 2020 | $3,288 | $571,800 | $0 | $571,800 |
| 2019 | $3,148 | $529,900 | $0 | $529,900 |
| 2018 | $3,127 | $485,600 | $0 | $485,600 |
| 2017 | $2,899 | $446,700 | $0 | $446,700 |
| 2016 | $2,786 | $398,600 | $0 | $398,600 |
| 2015 | $2,755 | $352,300 | $0 | $352,300 |
| 2014 | $2,708 | $323,200 | $0 | $323,200 |
Source: Public Records
Map
Nearby Homes
- 43 Linnaean St Unit 42
- 22 Agassiz St
- 69A Walker St Unit A
- 9 Chauncy St Unit 61
- 13 Mellen St Unit Front
- 1600 Massachusetts Ave Unit 404
- 86 Avon Hill St
- 202 Garden St
- 31-33 Mellen St
- 52 Garden St Unit B2
- 35 Mellen St
- 3 Arlington St Unit 52
- 44 Garden St
- 15-15A Forest St
- 37 Mellen St
- 72 Oxford St Unit 72
- 72 Oxford St
- 74 Oxford St
- 74 Oxford St Unit 3
- 84 Garden St
- 77 Martin St Unit 6
- 77 Martin St Unit 2B
- 77 Martin St Unit 36
- 77 Martin St Unit 3
- 77 Martin St Unit 1
- 77 Martin St
- 77 Martin St Unit 43
- 77 Martin St Unit 47
- 77 Martin St Unit 38
- 77 Martin St Unit 37,77
- 77 Martin St Unit 35,77
- 77 Martin St Unit 8
- 77 Martin St Unit 46
- 77 Martin St Unit 5
- 77 Martin St Unit 37
- 79 Martin St Unit 41
- 79 Martin St Unit 24
- 79 Martin St
- 79 Martin St Unit 21
- 79 Martin St Unit 43