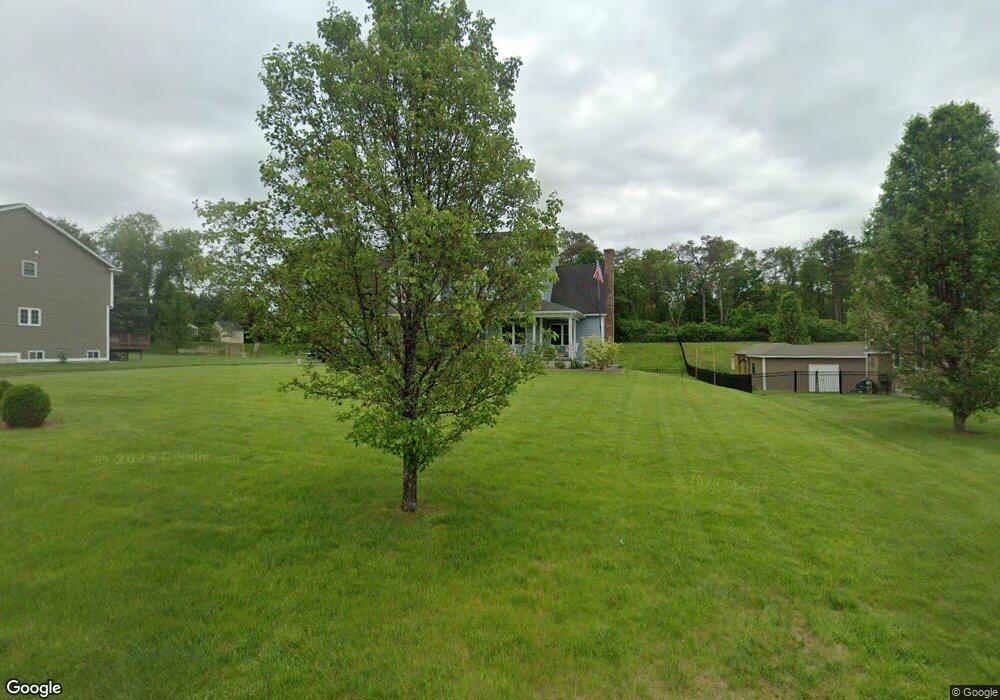
77 Massey St Westfield, MA 01085
Estimated Value: $624,000 - $723,000
3
Beds
3
Baths
2,937
Sq Ft
$225/Sq Ft
Est. Value
About This Home
This home is located at 77 Massey St, Westfield, MA 01085 and is currently estimated at $660,760, approximately $224 per square foot. 77 Massey St is a home with nearby schools including Westfield High School and Saint Mary High School.
Ownership History
Date
Name
Owned For
Owner Type
Purchase Details
Closed on
Jul 27, 2022
Sold by
Raymaakers John L and Raymaakers Karen A
Bought by
Raymaakers Ft
Current Estimated Value
Purchase Details
Closed on
Jan 25, 2013
Sold by
Cowles & Cowles Llc
Bought by
Raymaakers 3Rd John L and Raymaakers Karen A
Home Financials for this Owner
Home Financials are based on the most recent Mortgage that was taken out on this home.
Original Mortgage
$272,700
Interest Rate
3.35%
Mortgage Type
New Conventional
Create a Home Valuation Report for This Property
The Home Valuation Report is an in-depth analysis detailing your home's value as well as a comparison with similar homes in the area
Home Values in the Area
Average Home Value in this Area
Purchase History
| Date | Buyer | Sale Price | Title Company |
|---|---|---|---|
| Raymaakers Ft | -- | None Available | |
| Raymaakers 3Rd John L | $100,000 | -- |
Source: Public Records
Mortgage History
| Date | Status | Borrower | Loan Amount |
|---|---|---|---|
| Previous Owner | Raymaakers 3Rd John L | $272,700 |
Source: Public Records
Tax History
| Year | Tax Paid | Tax Assessment Tax Assessment Total Assessment is a certain percentage of the fair market value that is determined by local assessors to be the total taxable value of land and additions on the property. | Land | Improvement |
|---|---|---|---|---|
| 2025 | $8,842 | $582,500 | $153,000 | $429,500 |
| 2024 | $8,892 | $556,800 | $139,300 | $417,500 |
| 2023 | $8,761 | $535,200 | $132,600 | $402,600 |
| 2022 | $8,761 | $473,800 | $118,200 | $355,600 |
| 2021 | $8,502 | $450,300 | $111,500 | $338,800 |
| 2020 | $8,420 | $437,400 | $111,500 | $325,900 |
| 2019 | $8,238 | $418,800 | $106,200 | $312,600 |
| 2018 | $8,108 | $418,800 | $106,200 | $312,600 |
| 2017 | $7,894 | $406,500 | $107,200 | $299,300 |
| 2016 | $7,566 | $389,200 | $94,100 | $295,100 |
| 2015 | $6,819 | $367,800 | $94,100 | $273,700 |
| 2014 | $5,199 | $286,000 | $94,100 | $191,900 |
Source: Public Records
Map
Nearby Homes
- 166 Montgomery Rd
- 153 Prospect Street Extension
- 13 Furrow St
- 163 Prospect Street Extension
- 9 Montgomery St
- Lot 3 Montgomery
- 0 Lockhouse Rd Unit 73473161
- 3 Belmont St
- 19 Arch Rd
- 113 Franklin St
- 12 Sibley Ave
- 19 Kellogg St
- 118 Woodside Terrace
- 35 Jefferson St
- 83 Mechanic St
- 67 Woodside Terrace
- 13 Green Ave
- 26 Washington St
- 24 Sunflower Ln Unit B
- 3 Butler St