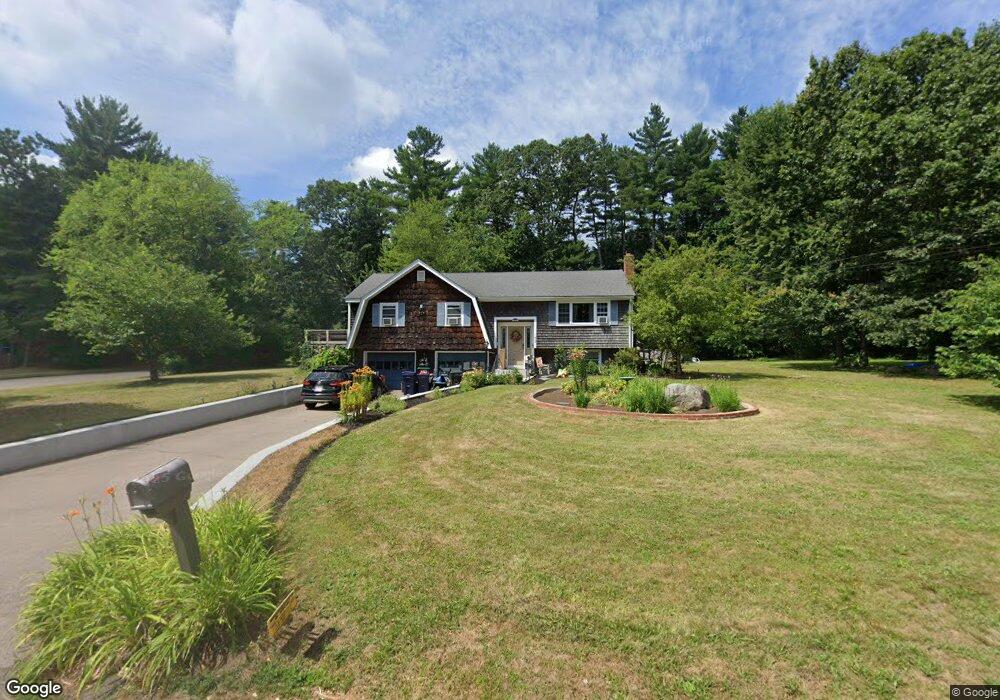
77 N High St Foxboro, MA 02035
Estimated Value: $638,000 - $696,000
3
Beds
2
Baths
1,232
Sq Ft
$531/Sq Ft
Est. Value
About This Home
This home is located at 77 N High St, Foxboro, MA 02035 and is currently estimated at $653,957, approximately $530 per square foot. 77 N High St is a home located in Norfolk County with nearby schools including Foxborough High School, Foxborough Regional Charter School, and Hands-On-Montessori School.
Ownership History
Date
Name
Owned For
Owner Type
Purchase Details
Closed on
Mar 11, 2022
Sold by
Kerrigan Robert P and Kerrigan Erika M
Bought by
Kerrigan Erika
Current Estimated Value
Home Financials for this Owner
Home Financials are based on the most recent Mortgage that was taken out on this home.
Original Mortgage
$425,315
Outstanding Balance
$397,067
Interest Rate
3.85%
Mortgage Type
FHA
Estimated Equity
$256,890
Purchase Details
Closed on
Mar 31, 2004
Sold by
Geary Mary A
Bought by
Kerrigan Erika M and Kerrigan Robert P
Home Financials for this Owner
Home Financials are based on the most recent Mortgage that was taken out on this home.
Original Mortgage
$250,000
Interest Rate
5.56%
Mortgage Type
Purchase Money Mortgage
Create a Home Valuation Report for This Property
The Home Valuation Report is an in-depth analysis detailing your home's value as well as a comparison with similar homes in the area
Home Values in the Area
Average Home Value in this Area
Purchase History
| Date | Buyer | Sale Price | Title Company |
|---|---|---|---|
| Kerrigan Erika | -- | None Available | |
| Kerrigan Erika | -- | None Available | |
| Kerrigan Erika M | $331,000 | -- | |
| Kerrigan Erika M | $331,000 | -- |
Source: Public Records
Mortgage History
| Date | Status | Borrower | Loan Amount |
|---|---|---|---|
| Open | Kerrigan Erika | $425,315 | |
| Closed | Kerrigan Erika | $425,315 | |
| Previous Owner | Kerrigan Erika M | $250,000 | |
| Previous Owner | Kerrigan Erika M | $30,000 |
Source: Public Records
Tax History Compared to Growth
Tax History
| Year | Tax Paid | Tax Assessment Tax Assessment Total Assessment is a certain percentage of the fair market value that is determined by local assessors to be the total taxable value of land and additions on the property. | Land | Improvement |
|---|---|---|---|---|
| 2025 | $7,364 | $557,000 | $262,100 | $294,900 |
| 2024 | $7,077 | $523,800 | $262,100 | $261,700 |
| 2023 | $6,890 | $484,900 | $249,700 | $235,200 |
| 2022 | $6,644 | $457,600 | $239,000 | $218,600 |
| 2021 | $5,903 | $400,500 | $217,300 | $183,200 |
| 2020 | $5,523 | $379,100 | $217,300 | $161,800 |
| 2019 | $5,374 | $365,600 | $206,900 | $158,700 |
| 2018 | $5,087 | $359,500 | $206,900 | $152,600 |
| 2017 | $5,087 | $338,200 | $193,300 | $144,900 |
| 2016 | $4,938 | $333,200 | $186,200 | $147,000 |
| 2015 | $4,669 | $307,400 | $157,200 | $150,200 |
| 2014 | $4,705 | $313,900 | $154,100 | $159,800 |
Source: Public Records
Map
Nearby Homes
- 356 Central St
- 12 Spring St
- 450 West St
- 166 Chauncy St
- 11 W Belcher Rd Unit 2
- 80 Mill St
- 406 South St
- 42 Angell St
- 44 Angell St Unit 44
- 619 N Main St
- 18 Winter St Unit E
- 14 Winter St Unit B
- 84 Cocasset St Unit A6
- 22 Pleasant St Unit C
- 24 Mechanic St
- 14 Baker St
- 11 Orchard Place Unit 11
- 82 Brook St
- 28 Court St
- 38 Court St