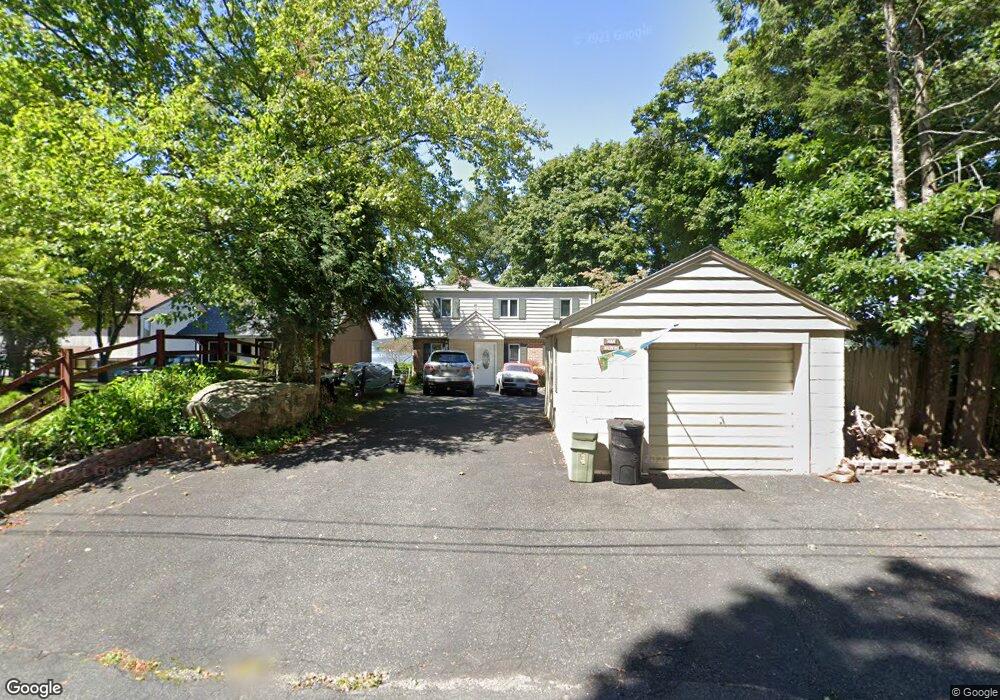
77 Nolans Point Park Rd Lake Hopatcong, NJ 07849
Estimated Value: $884,000 - $1,093,000
--
Bed
--
Bath
2,073
Sq Ft
$457/Sq Ft
Est. Value
About This Home
This home is located at 77 Nolans Point Park Rd, Lake Hopatcong, NJ 07849 and is currently estimated at $946,863, approximately $456 per square foot. 77 Nolans Point Park Rd is a home located in Morris County with nearby schools including Jefferson Township Middle School and Jefferson Township High School.
Ownership History
Date
Name
Owned For
Owner Type
Purchase Details
Closed on
May 27, 2010
Sold by
Nolans Point Park Llc
Bought by
Douma Glenn K and Kushinka Douma Candice L
Current Estimated Value
Purchase Details
Closed on
Aug 31, 2009
Sold by
Barrick James L and Barrick Sharon
Bought by
Nolans Point Park Llc
Purchase Details
Closed on
Jan 31, 2007
Sold by
Hill Mark
Bought by
Barrick James and Barrick Sharon
Home Financials for this Owner
Home Financials are based on the most recent Mortgage that was taken out on this home.
Original Mortgage
$576,000
Interest Rate
10.5%
Mortgage Type
Adjustable Rate Mortgage/ARM
Purchase Details
Closed on
Apr 13, 2005
Sold by
Barrick James L
Bought by
Hill Mark F
Home Financials for this Owner
Home Financials are based on the most recent Mortgage that was taken out on this home.
Original Mortgage
$568,000
Interest Rate
5.79%
Mortgage Type
New Conventional
Create a Home Valuation Report for This Property
The Home Valuation Report is an in-depth analysis detailing your home's value as well as a comparison with similar homes in the area
Home Values in the Area
Average Home Value in this Area
Purchase History
| Date | Buyer | Sale Price | Title Company |
|---|---|---|---|
| Douma Glenn K | $540,000 | Multiple | |
| Nolans Point Park Llc | $330,000 | None Available | |
| Nolans Point Park Llc | -- | None Available | |
| Barrick James | $720,000 | -- | |
| Hill Mark F | $710,000 | -- |
Source: Public Records
Mortgage History
| Date | Status | Borrower | Loan Amount |
|---|---|---|---|
| Previous Owner | Barrick James | $576,000 | |
| Previous Owner | Hill Mark F | $568,000 |
Source: Public Records
Tax History Compared to Growth
Tax History
| Year | Tax Paid | Tax Assessment Tax Assessment Total Assessment is a certain percentage of the fair market value that is determined by local assessors to be the total taxable value of land and additions on the property. | Land | Improvement |
|---|---|---|---|---|
| 2025 | $21,050 | $701,200 | $390,600 | $310,600 |
| 2024 | $20,517 | $701,200 | $390,600 | $310,600 |
| 2023 | $20,517 | $701,200 | $390,600 | $310,600 |
| 2022 | $19,592 | $701,200 | $390,600 | $310,600 |
| 2021 | $19,592 | $701,200 | $390,600 | $310,600 |
| 2020 | $18,778 | $683,600 | $390,600 | $293,000 |
| 2019 | $18,688 | $679,800 | $389,500 | $290,300 |
| 2018 | $18,498 | $663,500 | $384,400 | $279,100 |
| 2017 | $18,155 | $639,700 | $374,000 | $265,700 |
| 2016 | $17,263 | $642,000 | $374,000 | $268,000 |
| 2015 | $16,895 | $613,700 | $374,000 | $239,700 |
| 2014 | $15,627 | $573,900 | $334,200 | $239,700 |
Source: Public Records
Map
Nearby Homes
- 67 Nolans Point Rd
- 15 Castle Rock Rd
- 40 Castle Rock Rd
- 59 Homestead Rd
- 31 Cove Rd
- 13 Stonehenge Rd
- 36 S Cherry Rd
- 58 E Shore Rd
- 32 Mcnabb Rd
- 11 Bass Rock Rd
- 12 Bass Rock Rd
- 221 S New Jersey Ave
- 15 Benedict Dr
- 145 Schwarz Blvd
- 201 S New Jersey Ave
- 11 Maine St
- 221 S Maryland Ave
- 34 Iowa Ave
- 24 Southard Rd
- 56 Minnisink Rd
- 79 Nolans Point Park Rd
- 75 Nolans Point Park Rd
- 81 Nolans Point Park Rd
- 73 Nolans Point Park Rd
- 60 Nolans Point Park Rd
- 69 Nolans Point Park Rd
- 85 Nolans Point Park Rd
- 65 Nolans Point Park Rd
- 64 Nolans Point Park Rd
- 63 Nolans Point Park Rd
- 68 Nolans Point Park Rd
- 34 Park Ave Nolans
- 52 Nolans Point Park Rd
- 74 Nolans Point Park Rd
- 15 Henry St
- 61 Nolans Point Park Rd
- 89 Nolans Point Park Rd
- 50 Nolans Point Park Rd
- 59 Nolans Point Park Rd
- 54 Nolans Point Park Rd