
Landlord's Agent in 2024
Lynn Azzinaro
RE/MAX South County
(401) 742-4584
42 in this area
70 Total Sales
Estimated Value: $370,332
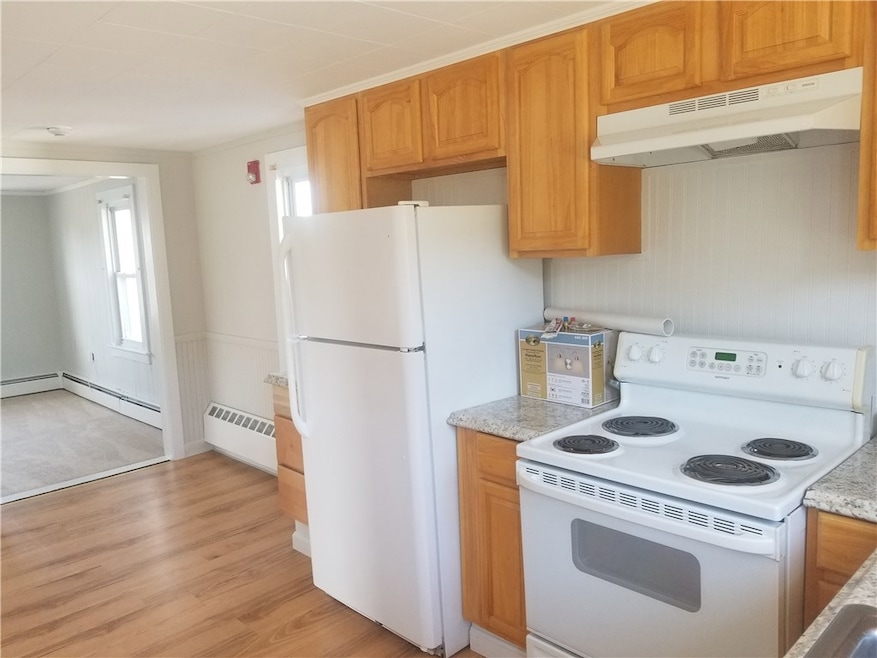
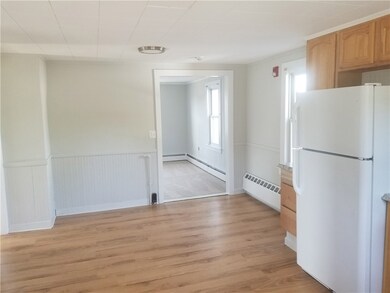
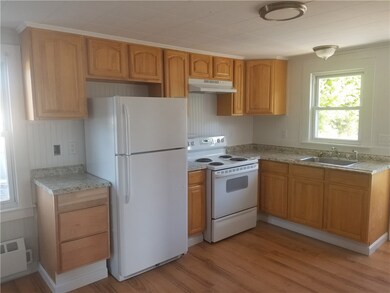
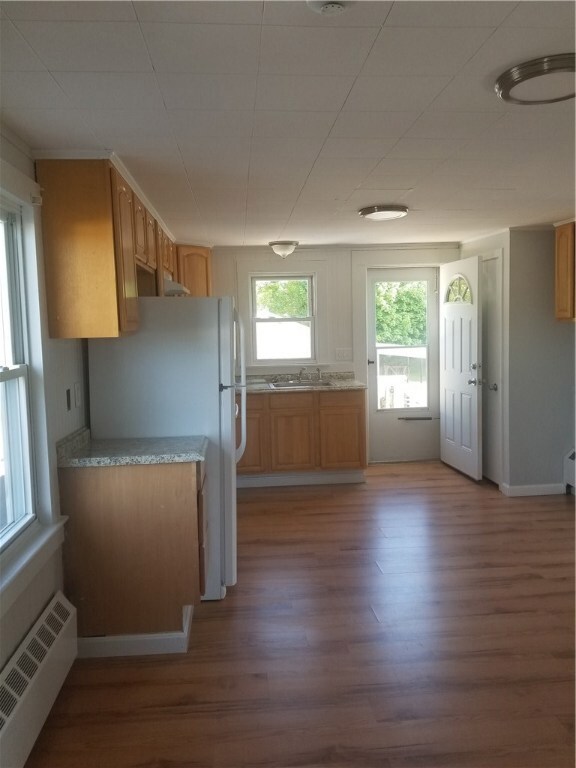
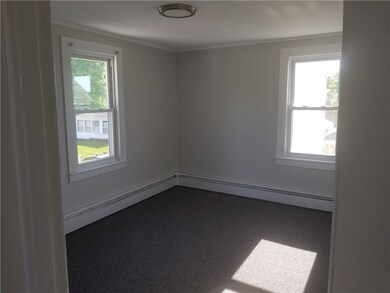
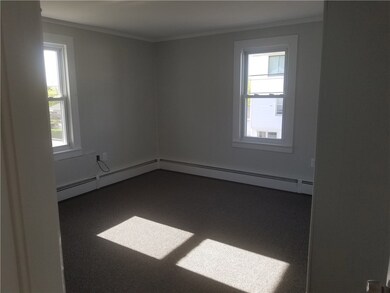
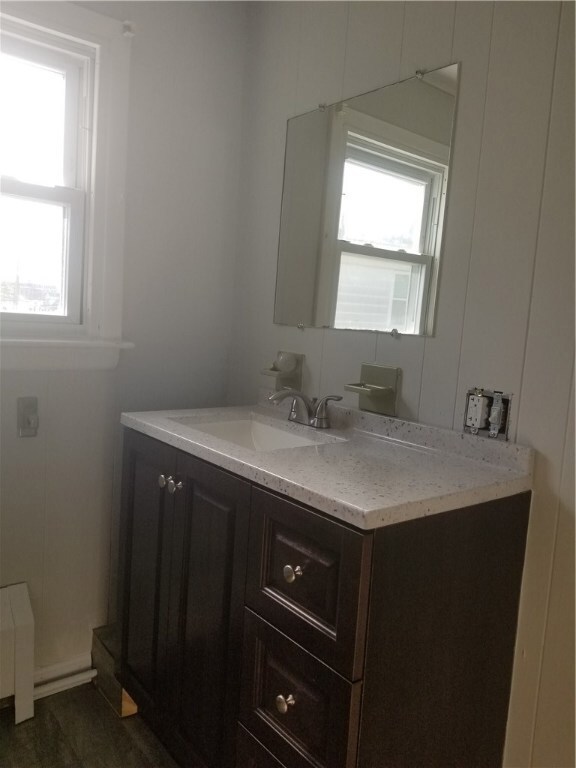
Bright move in condition 2BR, 1B; 2nd floor apartment 2 bedroom, 1 bath 2nd floor apartment, washer/dryer hookups in unit for a stackable set. Off Street Parking. ------------------------- No Pets, No Smoking, references and security deposit required. ------------------------
Last Agent to Rent the Property
RE/MAX South County License #REC.0014390 Listed on: 10/10/2024
| Date | Buyer | Sale Price | Title Company |
|---|---|---|---|
| Desantis Patricia M | -- | -- |
| Date | Status | Borrower | Loan Amount |
|---|---|---|---|
| Open | Desantis Patricia M | $160,000 | |
| Previous Owner | Desantis Patricia M | $160,000 | |
| Previous Owner | Desantis Patricia M | $18,500 |
| Date | Event | Price | List to Sale | Price per Sq Ft | Prior Sale |
|---|---|---|---|---|---|
| 10/24/2024 10/24/24 | Rented | $1,600 | +6.7% | -- | |
| 10/24/2024 10/24/24 | Under Contract | -- | -- | -- | |
| 10/10/2024 10/10/24 | For Rent | $1,500 | 0.0% | -- | |
| 07/25/2024 07/25/24 | Rented | $1,500 | 0.0% | -- | |
| 07/15/2024 07/15/24 | For Rent | $1,500 | 0.0% | -- | |
| 12/08/2023 12/08/23 | Rented | $1,500 | 0.0% | -- | |
| 11/14/2023 11/14/23 | For Rent | $1,500 | +3.4% | -- | |
| 06/06/2022 06/06/22 | Rented | $1,450 | 0.0% | -- | |
| 06/03/2022 06/03/22 | For Rent | $1,450 | +52.6% | -- | |
| 05/22/2018 05/22/18 | For Rent | $950 | 0.0% | -- | |
| 05/22/2018 05/22/18 | Rented | $950 | +6.1% | -- | |
| 08/16/2017 08/16/17 | For Rent | $895 | 0.0% | -- | |
| 08/16/2017 08/16/17 | Rented | $895 | 0.0% | -- | |
| 12/22/2016 12/22/16 | Sold | $185,000 | -7.0% | $67 / Sq Ft | View Prior Sale |
| 11/22/2016 11/22/16 | Pending | -- | -- | -- | |
| 11/15/2016 11/15/16 | For Sale | $199,000 | -- | $72 / Sq Ft |
| Year | Tax Paid | Tax Assessment Tax Assessment Total Assessment is a certain percentage of the fair market value that is determined by local assessors to be the total taxable value of land and additions on the property. | Land | Improvement |
|---|---|---|---|---|
| 2025 | $1,845 | $237,100 | $107,700 | $129,400 |
| 2024 | $2,186 | $209,200 | $97,500 | $111,700 |
| 2023 | $2,125 | $209,200 | $97,500 | $111,700 |
| 2022 | $2,113 | $209,200 | $97,500 | $111,700 |
| 2021 | $2,398 | $198,800 | $92,800 | $106,000 |
| 2020 | $2,356 | $198,800 | $92,800 | $106,000 |
| 2019 | $2,334 | $198,800 | $92,800 | $106,000 |
| 2018 | $2,453 | $198,600 | $90,100 | $108,500 |
| 2017 | $2,383 | $198,600 | $90,100 | $108,500 |
| 2016 | $2,383 | $198,600 | $90,100 | $108,500 |
| 2015 | $2,318 | $206,400 | $90,100 | $116,300 |
| 2014 | $2,281 | $206,400 | $90,100 | $116,300 |
Landlord's Agent in 2024
Lynn Azzinaro
RE/MAX South County
(401) 742-4584
42 in this area
70 Total Sales
Seller's Agent in 2023
James Rokos
RE/MAX South County
1 in this area
2 Total Sales
Seller's Agent in 2016
Deb Thomas
Schilke Realty
(860) 235-9466
40 in this area
63 Total Sales
Source: State-Wide MLS
MLS Number: 1370638
APN: WEST-000047-000179
Disclaimer: Certain information contained herein is derived from information provided by parties other than Homes.com. All information provided is deemed reliable, but is not guaranteed to be accurate and should be independently verified.
![]() IDX information is provided exclusively for personal, non-commercial use, and may not be used for any purpose other than to identify prospective properties consumers may be interested in purchasing. Information is deemed reliable but not guaranteed.
IDX information is provided exclusively for personal, non-commercial use, and may not be used for any purpose other than to identify prospective properties consumers may be interested in purchasing. Information is deemed reliable but not guaranteed.
Copyright © 2025 State-Wide MLS, Inc. All rights reserved.