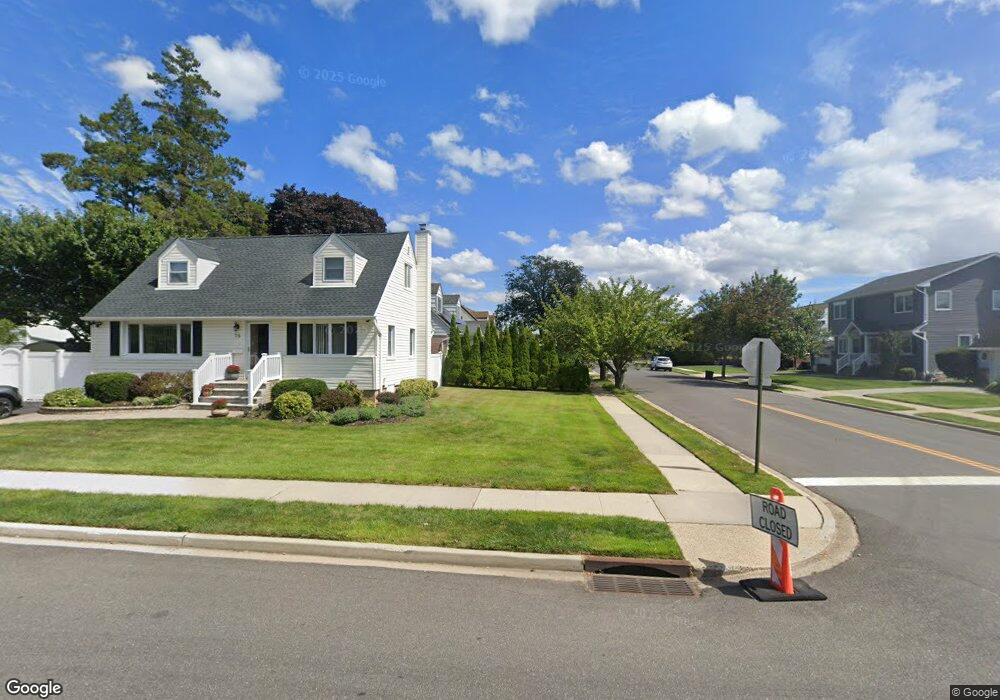
77 Orchard St Plainview, NY 11803
Estimated Value: $1,406,000 - $1,542,227
--
Bed
--
Bath
1,596
Sq Ft
$924/Sq Ft
Est. Value
About This Home
This home is located at 77 Orchard St, Plainview, NY 11803 and is currently estimated at $1,474,114, approximately $923 per square foot. 77 Orchard St is a home with nearby schools including Manhasset Secondary School, St Mary's Elementary School, and Our Lady of Grace Montessori School.
Ownership History
Date
Name
Owned For
Owner Type
Purchase Details
Closed on
Feb 15, 2019
Sold by
Park Min and Kwon David Oh
Bought by
Rlzm Llc
Current Estimated Value
Purchase Details
Closed on
Sep 27, 2013
Sold by
Bernstein Jay
Bought by
Park Min and Kwon David Oh
Home Financials for this Owner
Home Financials are based on the most recent Mortgage that was taken out on this home.
Original Mortgage
$678,400
Interest Rate
4.53%
Purchase Details
Closed on
Sep 6, 2006
Sold by
Hopkins Jacqueline
Bought by
Bernstein Jay
Purchase Details
Closed on
Jun 6, 2000
Sold by
Mason Michael and Mason Josephine
Bought by
Hopkins Joseph Jr and Hopkins Joseph Jacqueline
Purchase Details
Closed on
Apr 3, 1998
Purchase Details
Closed on
Jun 28, 1996
Sold by
Morgan Keith
Bought by
Mason Michael and Mason Josephine
Home Financials for this Owner
Home Financials are based on the most recent Mortgage that was taken out on this home.
Original Mortgage
$270,000
Interest Rate
7.98%
Create a Home Valuation Report for This Property
The Home Valuation Report is an in-depth analysis detailing your home's value as well as a comparison with similar homes in the area
Home Values in the Area
Average Home Value in this Area
Purchase History
| Date | Buyer | Sale Price | Title Company |
|---|---|---|---|
| Rlzm Llc | $900,000 | None Available | |
| Park Min | $848,000 | -- | |
| Bernstein Jay | $870,000 | -- | |
| Hopkins Joseph Jr | $601,000 | Joseph Hopkins | |
| -- | -- | -- | |
| Mason Michael | $360,000 | -- |
Source: Public Records
Mortgage History
| Date | Status | Borrower | Loan Amount |
|---|---|---|---|
| Previous Owner | Park Min | $678,400 | |
| Previous Owner | Mason Michael | $270,000 |
Source: Public Records
Tax History Compared to Growth
Tax History
| Year | Tax Paid | Tax Assessment Tax Assessment Total Assessment is a certain percentage of the fair market value that is determined by local assessors to be the total taxable value of land and additions on the property. | Land | Improvement |
|---|---|---|---|---|
| 2025 | $13,845 | $855 | $373 | $482 |
| 2024 | $4,293 | $818 | $357 | $461 |
| 2023 | $12,911 | $855 | $373 | $482 |
| 2022 | $12,911 | $855 | $373 | $482 |
| 2021 | $12,682 | $876 | $382 | $494 |
| 2020 | $12,913 | $1,204 | $1,038 | $166 |
| 2019 | $12,282 | $1,440 | $1,046 | $394 |
| 2018 | $12,282 | $1,440 | $0 | $0 |
| 2017 | $8,089 | $1,601 | $1,242 | $359 |
| 2016 | $13,147 | $1,601 | $1,242 | $359 |
| 2015 | $4,824 | $1,601 | $1,242 | $359 |
| 2014 | $4,824 | $1,601 | $1,242 | $359 |
| 2013 | $4,589 | $1,601 | $1,242 | $359 |
Source: Public Records
Map
Nearby Homes