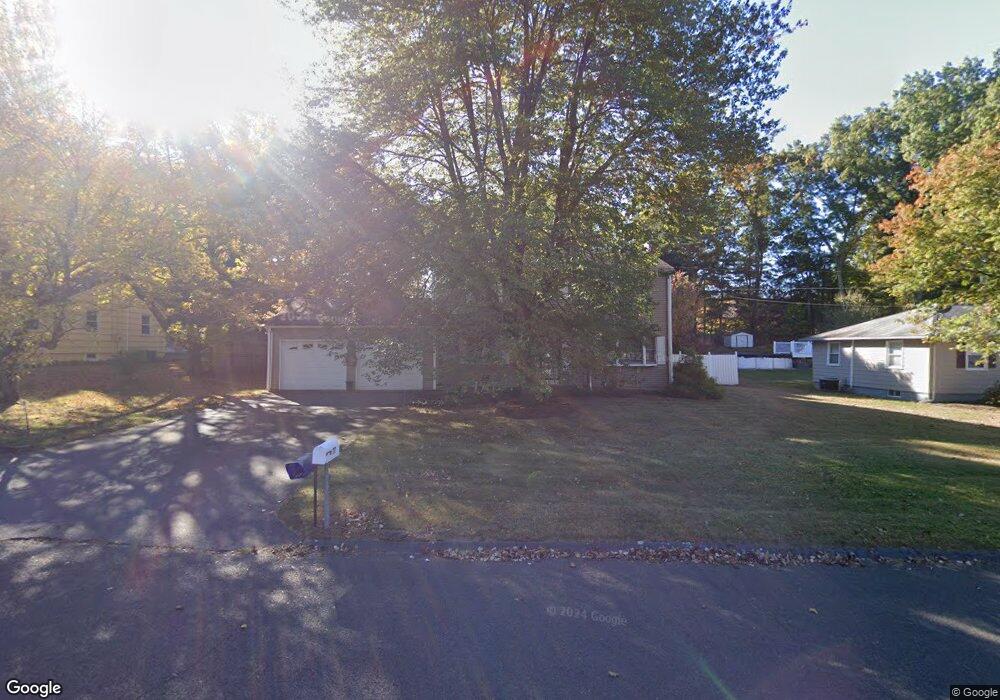
77 Pine Dr Southington, CT 06489
West Southington NeighborhoodEstimated Value: $408,000 - $499,000
4
Beds
3
Baths
1,728
Sq Ft
$266/Sq Ft
Est. Value
About This Home
This home is located at 77 Pine Dr, Southington, CT 06489 and is currently estimated at $460,206, approximately $266 per square foot. 77 Pine Dr is a home located in Hartford County with nearby schools including Urbin T. Kelley Elementary School, John F. Kennedy Middle School, and Southington High School.
Ownership History
Date
Name
Owned For
Owner Type
Purchase Details
Closed on
Aug 9, 1989
Sold by
Magrey Bradley
Bought by
Clement Henry
Current Estimated Value
Home Financials for this Owner
Home Financials are based on the most recent Mortgage that was taken out on this home.
Original Mortgage
$60,000
Interest Rate
9.93%
Purchase Details
Closed on
Jan 28, 1987
Sold by
Gamber Chris
Bought by
Magrey Bradley
Home Financials for this Owner
Home Financials are based on the most recent Mortgage that was taken out on this home.
Original Mortgage
$132,000
Interest Rate
9.26%
Create a Home Valuation Report for This Property
The Home Valuation Report is an in-depth analysis detailing your home's value as well as a comparison with similar homes in the area
Home Values in the Area
Average Home Value in this Area
Purchase History
| Date | Buyer | Sale Price | Title Company |
|---|---|---|---|
| Clement Henry | $188,000 | -- | |
| Magrey Bradley | $180,000 | -- |
Source: Public Records
Mortgage History
| Date | Status | Borrower | Loan Amount |
|---|---|---|---|
| Closed | Magrey Bradley | $50,000 | |
| Closed | Magrey Bradley | $60,000 | |
| Previous Owner | Magrey Bradley | $132,000 |
Source: Public Records
Tax History
| Year | Tax Paid | Tax Assessment Tax Assessment Total Assessment is a certain percentage of the fair market value that is determined by local assessors to be the total taxable value of land and additions on the property. | Land | Improvement |
|---|---|---|---|---|
| 2025 | $6,492 | $195,470 | $64,910 | $130,560 |
| 2024 | $6,146 | $195,470 | $64,910 | $130,560 |
| 2023 | $5,934 | $195,470 | $64,910 | $130,560 |
| 2022 | $5,694 | $195,470 | $64,910 | $130,560 |
| 2021 | $5,674 | $195,470 | $64,910 | $130,560 |
| 2020 | $5,247 | $171,290 | $66,230 | $105,060 |
| 2019 | $5,248 | $171,290 | $66,230 | $105,060 |
| 2018 | $5,221 | $171,290 | $66,230 | $105,060 |
| 2017 | $5,221 | $171,290 | $66,230 | $105,060 |
| 2016 | $5,077 | $171,290 | $66,230 | $105,060 |
| 2015 | $4,972 | $170,640 | $63,080 | $107,560 |
| 2014 | $4,839 | $170,640 | $63,080 | $107,560 |
Source: Public Records
Map
Nearby Homes
Your Personal Tour Guide
Ask me questions while you tour the home.