
Seller's Agent in 2026
DANIEL BEIRNE
OpenDoor Brokerage LLC
(480) 462-5392
2,045 Total Sales
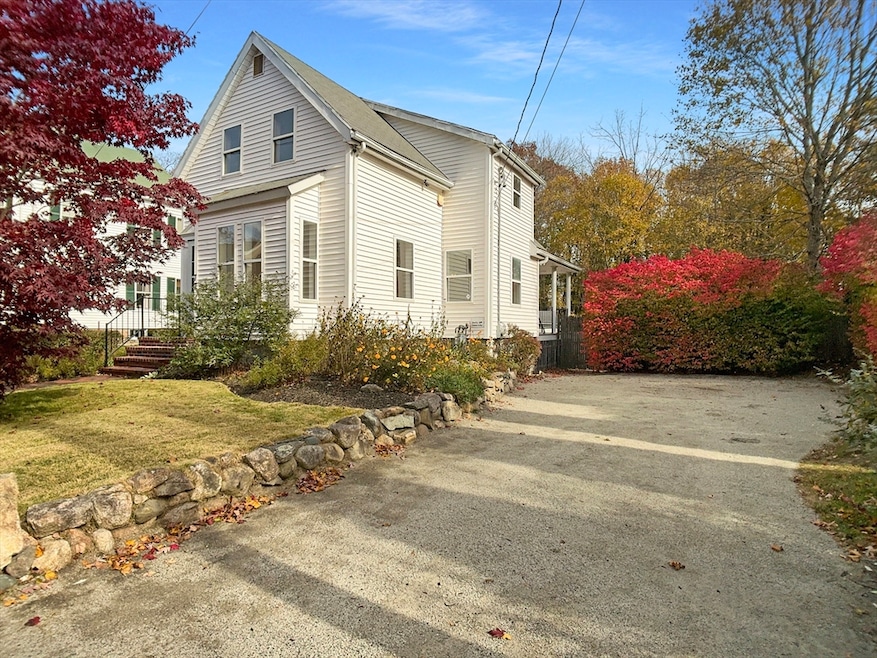
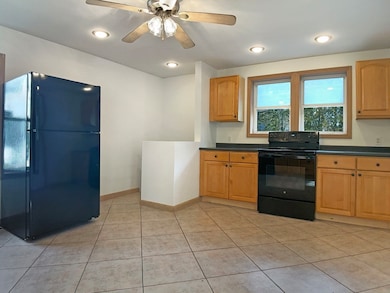
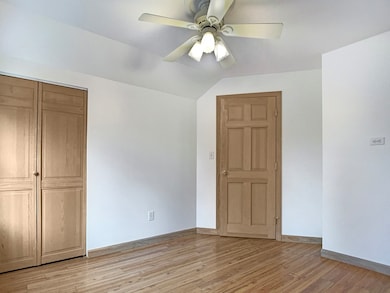
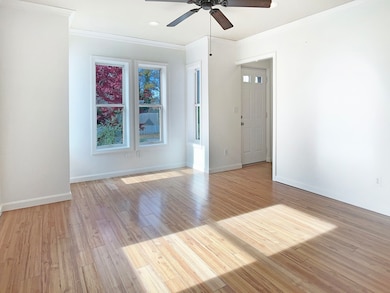

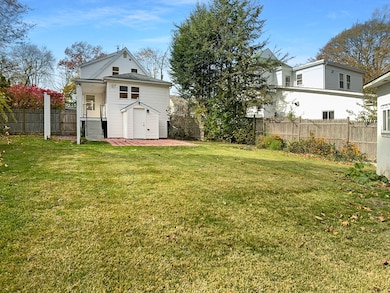
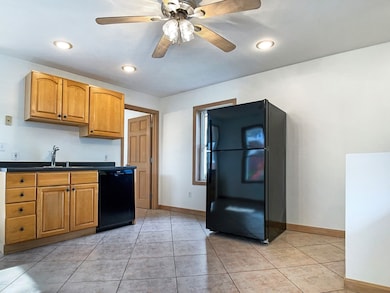
Welcome to this charming property that is sure to impress. The home boasts a neutral color paint scheme, providing a calming and inviting atmosphere. The fresh interior paint adds a touch of modernity and cleanliness. The property also features a storage shed, perfect for all your organizational needs. Enjoy the outdoors with a deck and patio in the back yard, both ideal for entertaining or simply relaxing. The fenced in backyard ensures privacy and security. This property is a must-see for those seeking a home with a blend of comfort and functionality. Included 100-Day Home Warranty with buyer activation.
| Date | Type | Sale Price | Title Company |
|---|---|---|---|
| Quit Claim Deed | $395,000 | -- | |
| Quit Claim Deed | $380,900 | -- | |
| Deed | $88,000 | -- | |
| Deed | $17,000 | -- | |
| Deed | $17,000 | -- |
| Date | Status | Loan Amount | Loan Type |
|---|---|---|---|
| Open | $316,000 | New Conventional | |
| Previous Owner | $106,750 | No Value Available | |
| Previous Owner | $50,000 | No Value Available | |
| Previous Owner | $116,725 | No Value Available |
| Date | Event | Price | List to Sale | Price per Sq Ft |
|---|---|---|---|---|
| 01/29/2026 01/29/26 | Sold | $395,000 | -4.8% | $355 / Sq Ft |
| 12/16/2025 12/16/25 | Pending | -- | -- | -- |
| 12/02/2025 12/02/25 | For Sale | $415,000 | 0.0% | $373 / Sq Ft |
| 11/18/2025 11/18/25 | Pending | -- | -- | -- |
| 11/12/2025 11/12/25 | For Sale | $415,000 | -- | $373 / Sq Ft |
| Year | Tax Paid | Tax Assessment Tax Assessment Total Assessment is a certain percentage of the fair market value that is determined by local assessors to be the total taxable value of land and additions on the property. | Land | Improvement |
|---|---|---|---|---|
| 2025 | $4,605 | $380,300 | $140,000 | $240,300 |
| 2024 | $4,535 | $377,300 | $140,000 | $237,300 |
| 2023 | $4,084 | $314,600 | $104,100 | $210,500 |
| 2022 | $3,870 | $277,000 | $94,600 | $182,400 |
| 2021 | $3,666 | $252,800 | $78,500 | $174,300 |
| 2020 | $3,085 | $203,600 | $73,600 | $130,000 |
| 2019 | $3,064 | $197,200 | $71,800 | $125,400 |
| 2018 | $3,114 | $193,900 | $71,800 | $122,100 |
| 2017 | $2,784 | $172,900 | $71,800 | $101,100 |
| 2016 | $2,587 | $149,000 | $69,600 | $79,400 |
| 2015 | $2,592 | $142,800 | $69,600 | $73,200 |
| 2014 | $2,453 | $135,300 | $69,600 | $65,700 |
Seller's Agent in 2026
DANIEL BEIRNE
OpenDoor Brokerage LLC
(480) 462-5392
2,045 Total Sales
D
Seller Co-Listing Agent in 2026
David Whitmore
OpenDoor Brokerage LLC
Buyer's Agent in 2026
Cindy Brouwer
Cindy Brouwer Real Estate
(508) 542-4362
165 Total Sales
Source: MLS Property Information Network (MLS PIN)
MLS Number: 73454031
APN: BROC-000098-000132
Disclaimer: Certain information contained herein is derived from information provided by parties other than Homes.com. All information provided is deemed reliable, but is not guaranteed to be accurate and should be independently verified.
![]() The property listing data and information, or the Images, set forth herein were provided to MLS Property Information Network, Inc. from third party sources, including sellers, lessors and public records, and were compiled by MLS Property Information Network, Inc. The property listing data and information, and the Images, are for the personal, non-commercial use of consumers having a good faith interest in purchasing or leasing listed properties of the type displayed to them and may not be used for any purpose other than to identify prospective properties which such consumers may have a good faith interest in purchasing or leasing. MLS Property Information Network, Inc. and its subscribers disclaim any and all representations and warranties as to the accuracy of the property listing data and information, or as to the accuracy of any of the Images, set forth herein.
The property listing data and information, or the Images, set forth herein were provided to MLS Property Information Network, Inc. from third party sources, including sellers, lessors and public records, and were compiled by MLS Property Information Network, Inc. The property listing data and information, and the Images, are for the personal, non-commercial use of consumers having a good faith interest in purchasing or leasing listed properties of the type displayed to them and may not be used for any purpose other than to identify prospective properties which such consumers may have a good faith interest in purchasing or leasing. MLS Property Information Network, Inc. and its subscribers disclaim any and all representations and warranties as to the accuracy of the property listing data and information, or as to the accuracy of any of the Images, set forth herein.
Ask me questions while you tour the home.