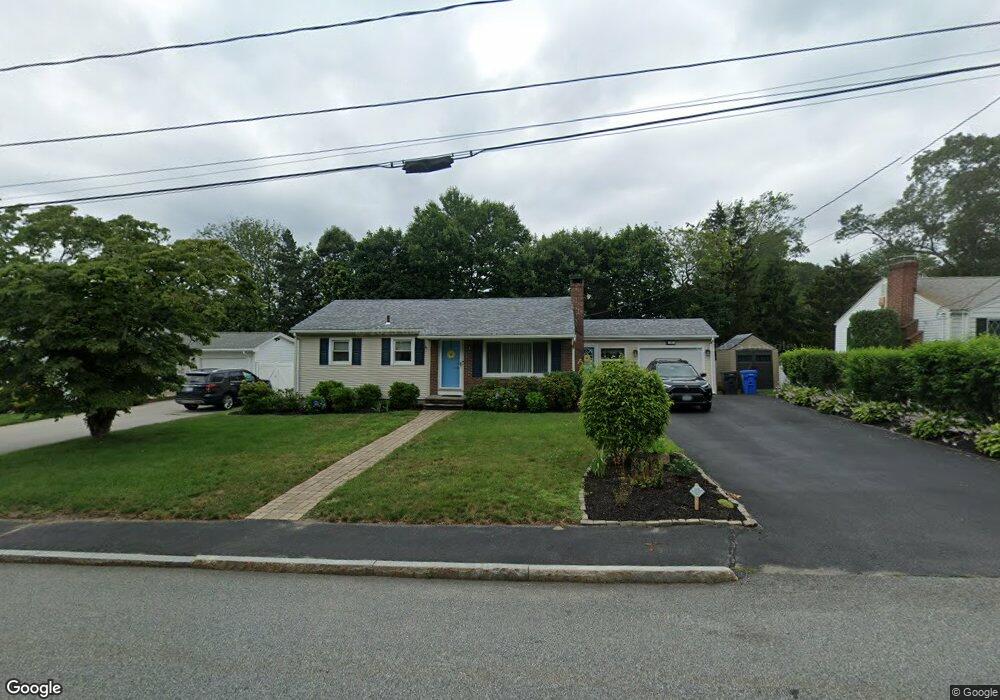
77 Ridgeway Rd Cranston, RI 02920
Garden Hills NeighborhoodEstimated Value: $386,000 - $457,000
3
Beds
1
Bath
973
Sq Ft
$430/Sq Ft
Est. Value
About This Home
This home is located at 77 Ridgeway Rd, Cranston, RI 02920 and is currently estimated at $418,146, approximately $429 per square foot. 77 Ridgeway Rd is a home located in Providence County with nearby schools including Glen Hills School, Western Hills Middle School, and Cranston High School West.
Ownership History
Date
Name
Owned For
Owner Type
Purchase Details
Closed on
Jun 12, 2023
Sold by
Mooney Christine M and Lusignan Stephen
Bought by
Lusignan-Meschino Irt and Lusignan
Current Estimated Value
Purchase Details
Closed on
Aug 25, 1994
Sold by
Difusco Richard Vincen
Bought by
Mooney Christine M
Create a Home Valuation Report for This Property
The Home Valuation Report is an in-depth analysis detailing your home's value as well as a comparison with similar homes in the area
Home Values in the Area
Average Home Value in this Area
Purchase History
| Date | Buyer | Sale Price | Title Company |
|---|---|---|---|
| Lusignan-Meschino Irt | -- | None Available | |
| Mooney Christine M | $100,000 | -- |
Source: Public Records
Mortgage History
| Date | Status | Borrower | Loan Amount |
|---|---|---|---|
| Previous Owner | Mooney Christine M | $210,800 | |
| Previous Owner | Mooney Christine M | $224,500 |
Source: Public Records
Tax History
| Year | Tax Paid | Tax Assessment Tax Assessment Total Assessment is a certain percentage of the fair market value that is determined by local assessors to be the total taxable value of land and additions on the property. | Land | Improvement |
|---|---|---|---|---|
| 2025 | $5,045 | $363,500 | $137,700 | $225,800 |
| 2024 | $4,947 | $363,500 | $137,700 | $225,800 |
| 2023 | $4,833 | $255,700 | $98,500 | $157,200 |
| 2022 | $4,733 | $255,700 | $98,500 | $157,200 |
| 2021 | $4,603 | $255,700 | $98,500 | $157,200 |
| 2020 | $4,526 | $217,900 | $98,500 | $119,400 |
| 2019 | $4,526 | $217,900 | $98,500 | $119,400 |
| 2018 | $4,421 | $217,900 | $98,500 | $119,400 |
| 2017 | $3,989 | $173,900 | $84,400 | $89,500 |
| 2016 | $3,904 | $173,900 | $84,400 | $89,500 |
| 2015 | $3,904 | $173,900 | $84,400 | $89,500 |
| 2014 | $3,775 | $165,300 | $80,900 | $84,400 |
Source: Public Records
Map
Nearby Homes
- 9 Tophill Cir
- 20 Hilltop Dr
- 26 Ellison St
- 33 Rose Hill Dr
- 14 Amanda St
- 20 Manilla Ave
- 15 Watkins Ave
- 78 Wilbur Ave
- 10 East St Unit 316
- 200 Mayfield Ave Unit C8
- 87 Lincoln Park Ave
- 82 Mountain Laurel Dr
- 309 East St
- 325 East St
- 339 East St
- 52 Cottonwood Dr
- 77 Valley View Dr
- 1027 Providence St Unit 4B
- 14 W Natick Rd
- 80 Conley Ave Unit 9
Your Personal Tour Guide
Ask me questions while you tour the home.