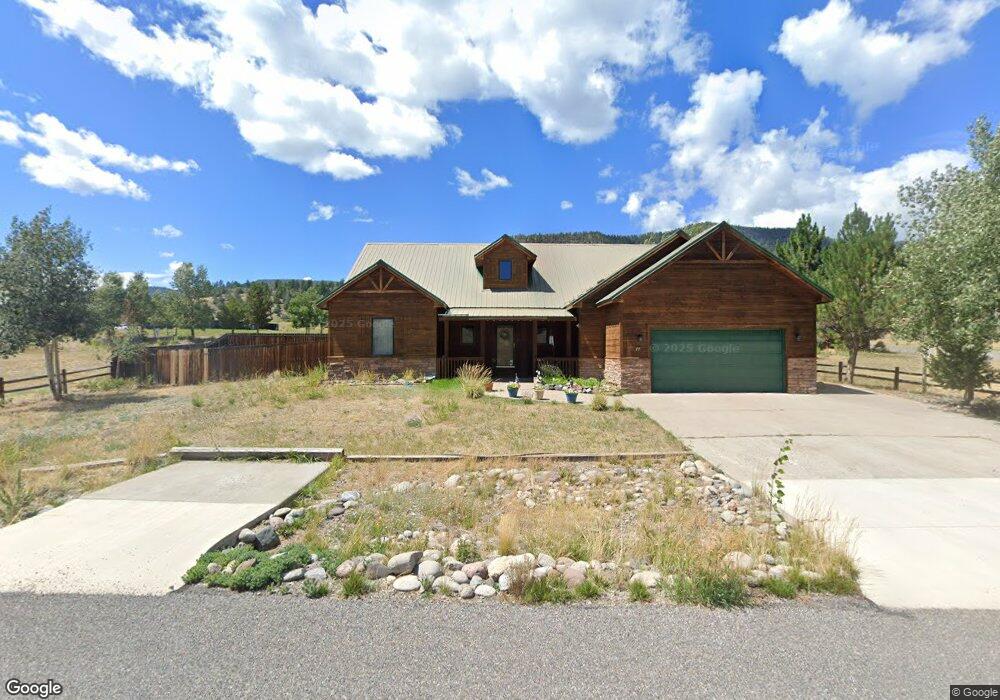
77 S Alder Creek Ln South Fork, CO 81154
Estimated Value: $567,122 - $675,000
3
Beds
3
Baths
1,869
Sq Ft
$333/Sq Ft
Est. Value
About This Home
This home is located at 77 S Alder Creek Ln, South Fork, CO 81154 and is currently estimated at $622,531, approximately $333 per square foot. 77 S Alder Creek Ln is a home located in Rio Grande County with nearby schools including Del Norte K-8 School and Del Norte High School.
Ownership History
Date
Name
Owned For
Owner Type
Purchase Details
Closed on
May 28, 2021
Sold by
Vanosdol L L
Bought by
Colditz Forrest
Current Estimated Value
Purchase Details
Closed on
Mar 12, 2018
Sold by
86 Trinity Llc
Bought by
Osdol L L Van
Home Financials for this Owner
Home Financials are based on the most recent Mortgage that was taken out on this home.
Original Mortgage
$208,800
Interest Rate
4.22%
Mortgage Type
New Conventional
Purchase Details
Closed on
Nov 10, 2015
Sold by
Bell Beverly L
Bought by
86 Trinity Llc
Purchase Details
Closed on
May 5, 2006
Sold by
Bell Melvin H
Bought by
Bell Beverly L
Home Financials for this Owner
Home Financials are based on the most recent Mortgage that was taken out on this home.
Original Mortgage
$391,000
Interest Rate
8.66%
Mortgage Type
Adjustable Rate Mortgage/ARM
Create a Home Valuation Report for This Property
The Home Valuation Report is an in-depth analysis detailing your home's value as well as a comparison with similar homes in the area
Home Values in the Area
Average Home Value in this Area
Purchase History
| Date | Buyer | Sale Price | Title Company |
|---|---|---|---|
| Colditz Forrest | $128,000 | None Available | |
| Osdol L L Van | $268,500 | None Available | |
| 86 Trinity Llc | -- | None Available | |
| Bell Beverly L | -- | None Available |
Source: Public Records
Mortgage History
| Date | Status | Borrower | Loan Amount |
|---|---|---|---|
| Previous Owner | Osdol L L Van | $208,800 | |
| Previous Owner | Bell Beverly L | $391,000 |
Source: Public Records
Tax History Compared to Growth
Tax History
| Year | Tax Paid | Tax Assessment Tax Assessment Total Assessment is a certain percentage of the fair market value that is determined by local assessors to be the total taxable value of land and additions on the property. | Land | Improvement |
|---|---|---|---|---|
| 2024 | $2,029 | $31,288 | $1,415 | $29,873 |
| 2023 | $2,029 | $31,288 | $1,415 | $29,873 |
| 2022 | $1,364 | $20,973 | $1,407 | $19,566 |
| 2021 | $1,381 | $21,577 | $1,448 | $20,129 |
| 2020 | $1,239 | $19,290 | $2,312 | $16,978 |
| 2019 | $1,241 | $19,290 | $2,312 | $16,978 |
| 2018 | $1,660 | $25,659 | $0 | $0 |
| 2017 | $1,674 | $25,659 | $0 | $0 |
| 2016 | $1,304 | $25,817 | $0 | $0 |
| 2015 | $3,151 | $25,817 | $0 | $0 |
| 2014 | $3,151 | $26,331 | $0 | $0 |
| 2013 | $1,526 | $27,366 | $0 | $0 |
Source: Public Records
Map
Nearby Homes
- 13 Fairway Dr
- 60 Fairway Dr
- 53 Fairway Dr
- 37 S Alder Creek Ln
- 88 Fairway Dr
- 19 S Alder Creek
- 96 Rio Grande Club Trail
- 93 Fairway Dr
- 27 Greenside Ct
- 31 Greenside Ct
- 26 Upper Reserve Dr
- 61 N Alder Creek Ln
- 398 Rio Grande Club Trail
- 472 Rio Grande Club Trail Unit 22
- 472 Rio Grande Club Trail
- 548 Blanca Vista Dr
- 365 Rio Grande Club Trail
- 80 N Alder Creek Ln
- 136 Hopi Ct
- 11 Blanca Vista Dr
- 28 Fairway Dr
- S Alder Creek Ln
- 0013 S Alder Creek Ln
- 69 S Alder Creek Ln
- 34 Fairway Dr
- 0083 S Alder Creek Ln
- 70 S Alder Creek Ln
- S Alder Creek Unit 69 Lane
- S Alder Creek Unit 70 Lane
- S Alder Creek
- 98 S Alder Creek Ln
- 58 S Alder Creek Ln
- 0098 Alder Creek
- Lot 60 009 S Alder Creek Ln
- 0091 S Alder Creek Ln
- 51 S Alder Creek Ln
- 106 S Alder Creek Ln
- 51 Alder Creek
- 23 Fairway Dr
- 23 Fairway Dr