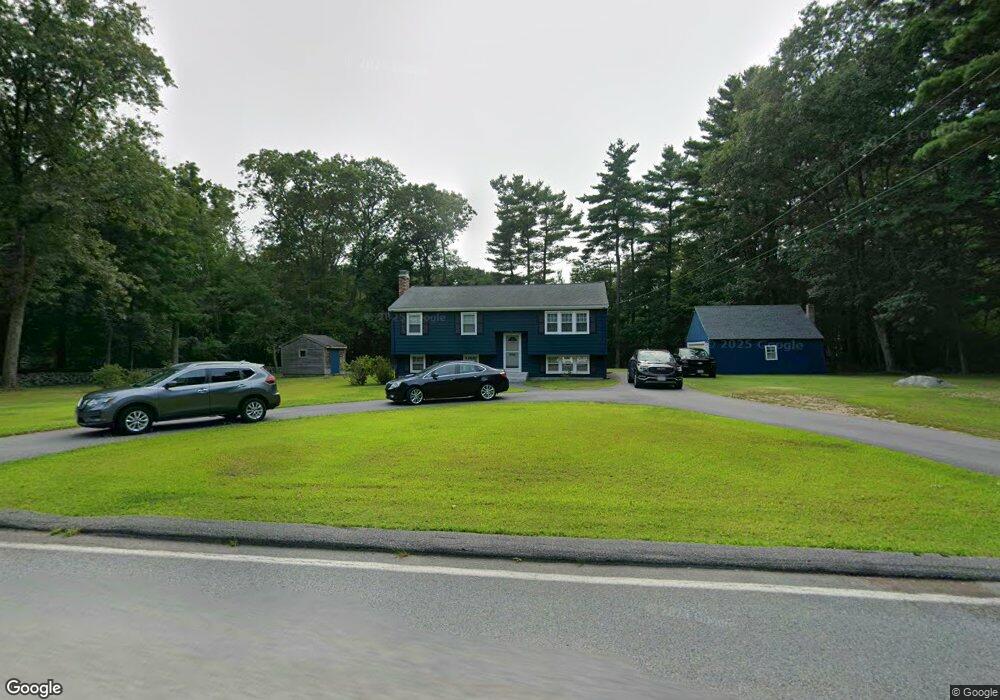
77 S Grove St Foxboro, MA 02035
Estimated Value: $583,164 - $674,000
3
Beds
2
Baths
1,188
Sq Ft
$528/Sq Ft
Est. Value
About This Home
This home is located at 77 S Grove St, Foxboro, MA 02035 and is currently estimated at $627,541, approximately $528 per square foot. 77 S Grove St is a home located in Norfolk County with nearby schools including Foxborough High School, Hands-On-Montessori School, and St Mary's Catholic School.
Ownership History
Date
Name
Owned For
Owner Type
Purchase Details
Closed on
Jun 18, 1998
Sold by
Kitchenka Francis L and Kitchenka Carol M
Bought by
Morrison Paul V and Morrison Nancy J
Current Estimated Value
Home Financials for this Owner
Home Financials are based on the most recent Mortgage that was taken out on this home.
Original Mortgage
$127,500
Interest Rate
7.09%
Mortgage Type
Purchase Money Mortgage
Create a Home Valuation Report for This Property
The Home Valuation Report is an in-depth analysis detailing your home's value as well as a comparison with similar homes in the area
Home Values in the Area
Average Home Value in this Area
Purchase History
| Date | Buyer | Sale Price | Title Company |
|---|---|---|---|
| Morrison Paul V | $170,000 | -- |
Source: Public Records
Mortgage History
| Date | Status | Borrower | Loan Amount |
|---|---|---|---|
| Open | Morrison Paul V | $141,000 | |
| Closed | Morrison Paul V | $127,500 | |
| Previous Owner | Morrison Paul V | $70,000 | |
| Closed | Morrison Paul V | $25,500 |
Source: Public Records
Tax History Compared to Growth
Tax History
| Year | Tax Paid | Tax Assessment Tax Assessment Total Assessment is a certain percentage of the fair market value that is determined by local assessors to be the total taxable value of land and additions on the property. | Land | Improvement |
|---|---|---|---|---|
| 2025 | $7,131 | $539,400 | $248,900 | $290,500 |
| 2024 | $6,728 | $498,000 | $248,900 | $249,100 |
| 2023 | $6,575 | $462,700 | $237,100 | $225,600 |
| 2022 | $6,196 | $426,700 | $227,000 | $199,700 |
| 2021 | $5,682 | $385,500 | $206,300 | $179,200 |
| 2020 | $5,334 | $366,100 | $206,300 | $159,800 |
| 2019 | $5,249 | $357,100 | $196,500 | $160,600 |
| 2018 | $5,120 | $351,400 | $196,500 | $154,900 |
| 2017 | $4,983 | $331,300 | $183,500 | $147,800 |
| 2016 | $4,916 | $331,700 | $176,800 | $154,900 |
| 2015 | $4,663 | $307,000 | $149,200 | $157,800 |
| 2014 | $4,558 | $304,100 | $146,300 | $157,800 |
Source: Public Records
Map
Nearby Homes