Estimated Value: $152,000 - $248,000
3
Beds
1
Bath
2,196
Sq Ft
$83/Sq Ft
Est. Value
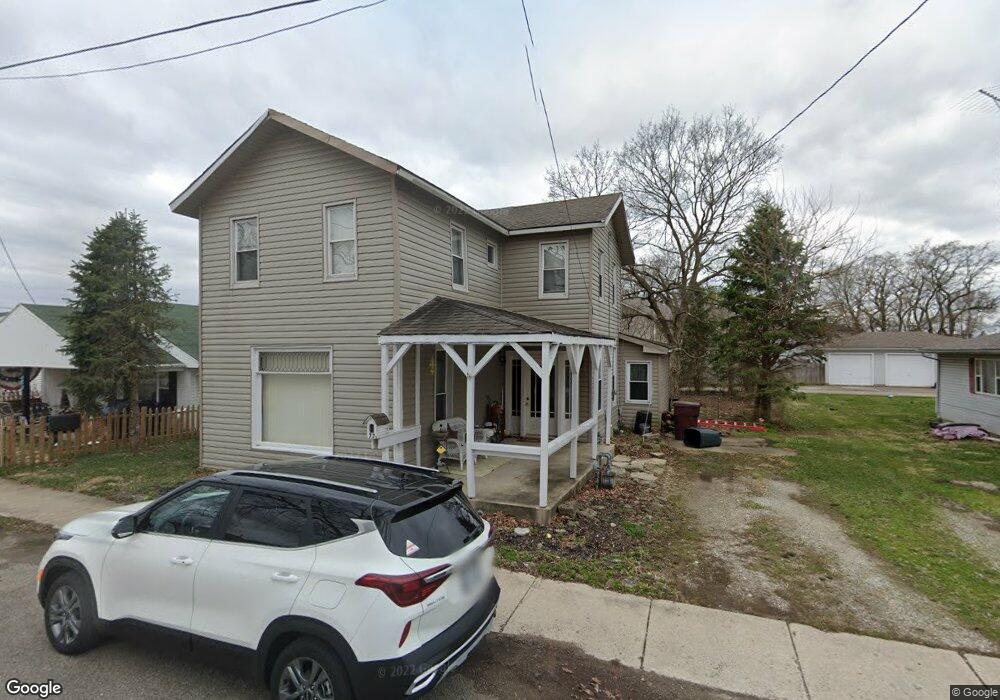
About This Home
This home is located at 77 S Pleasant St, Enon, OH 45323 and is currently estimated at $182,526, approximately $83 per square foot. 77 S Pleasant St is a home located in Clark County with nearby schools including Greenon Elementary School, Greenon Jr. High School, and Greenon High School.
Ownership History
Date
Name
Owned For
Owner Type
Purchase Details
Closed on
Jun 18, 2021
Sold by
Parsons Dawn Ann and Milheim Dawn Ann
Bought by
Rouse John W and Rouse Kristin
Current Estimated Value
Home Financials for this Owner
Home Financials are based on the most recent Mortgage that was taken out on this home.
Original Mortgage
$107,070
Outstanding Balance
$96,303
Interest Rate
2.9%
Mortgage Type
USDA
Estimated Equity
$86,223
Purchase Details
Closed on
Sep 26, 2000
Sold by
Womacks Jonathan D
Bought by
Parson Dawn Ann
Purchase Details
Closed on
Aug 3, 1999
Sold by
Mccomas Darrell L and Mc Comas Arlene R
Bought by
Parsons Dawn Ann and Womacks Jonathan D
Home Financials for this Owner
Home Financials are based on the most recent Mortgage that was taken out on this home.
Original Mortgage
$73,120
Interest Rate
7.77%
Mortgage Type
Stand Alone First
Create a Home Valuation Report for This Property
The Home Valuation Report is an in-depth analysis detailing your home's value as well as a comparison with similar homes in the area
Home Values in the Area
Average Home Value in this Area
Purchase History
| Date | Buyer | Sale Price | Title Company |
|---|---|---|---|
| Rouse John W | $106,000 | Aspen Land Title Agency | |
| Parson Dawn Ann | -- | -- | |
| Parsons Dawn Ann | $71,000 | -- |
Source: Public Records
Mortgage History
| Date | Status | Borrower | Loan Amount |
|---|---|---|---|
| Open | Rouse John W | $107,070 | |
| Previous Owner | Parsons Dawn Ann | $73,120 |
Source: Public Records
Tax History
| Year | Tax Paid | Tax Assessment Tax Assessment Total Assessment is a certain percentage of the fair market value that is determined by local assessors to be the total taxable value of land and additions on the property. | Land | Improvement |
|---|---|---|---|---|
| 2025 | $2,344 | $49,180 | $8,100 | $41,080 |
| 2024 | $2,353 | $40,980 | $7,740 | $33,240 |
| 2023 | $2,353 | $40,980 | $7,740 | $33,240 |
| 2022 | $2,351 | $40,980 | $7,740 | $33,240 |
| 2021 | $2,166 | $33,310 | $6,290 | $27,020 |
| 2020 | $2,171 | $33,310 | $6,290 | $27,020 |
| 2019 | $2,198 | $33,310 | $6,290 | $27,020 |
| 2018 | $2,014 | $29,620 | $6,290 | $23,330 |
| 2017 | $2,019 | $29,618 | $6,290 | $23,328 |
| 2016 | $1,734 | $29,618 | $6,290 | $23,328 |
| 2015 | $2,982 | $28,743 | $6,290 | $22,453 |
| 2014 | $1,738 | $28,743 | $6,290 | $22,453 |
| 2013 | $2,472 | $28,743 | $6,290 | $22,453 |
Source: Public Records
Map
Nearby Homes
- 303 E Main St
- 141 N Xenia Dr
- 100 Green Valley Dr
- 3924 Schenley St
- 4024 Raymond Dr
- 4200 Phillips St
- 4538 Cynthia Dr
- 144 Matthews Ave
- 2151 Willow Run Cir Unit 2151
- 2133 Willow Run Cir Unit 2133
- 2072 Willow Run Cir
- 7050 Creekside Cir
- 4600 Snider Rd
- 1010 Meadow Lark Dr
- 5463 Enon-Xenia Rd
- 7850 Kings Ridge Cir
- 2925 S Tecumseh Rd
- 0 Enon-Xenia Rd
- 6 Danzig Ln
- 5139 Waverly St
- 79 S Pleasant St
- 85 S Pleasant St
- 59 S Pleasant St Unit B
- 41 S Pleasant St
- 95 S Pleasant St
- 76 S Pleasant St
- 84 S Pleasant St
- 60 S Pleasant St
- 94 S Pleasant St
- 40 S Pleasant St
- 30 S Xenia Dr
- 80 S Xenia Dr
- 57 E Main St
- 120 Broadway Rd
- 41 E Main St
- 59 E Main St
- 121 E Main St
- 103 E Main St
- 31 S Harrison St
- 43 S Harrison St
Your Personal Tour Guide
Ask me questions while you tour the home.