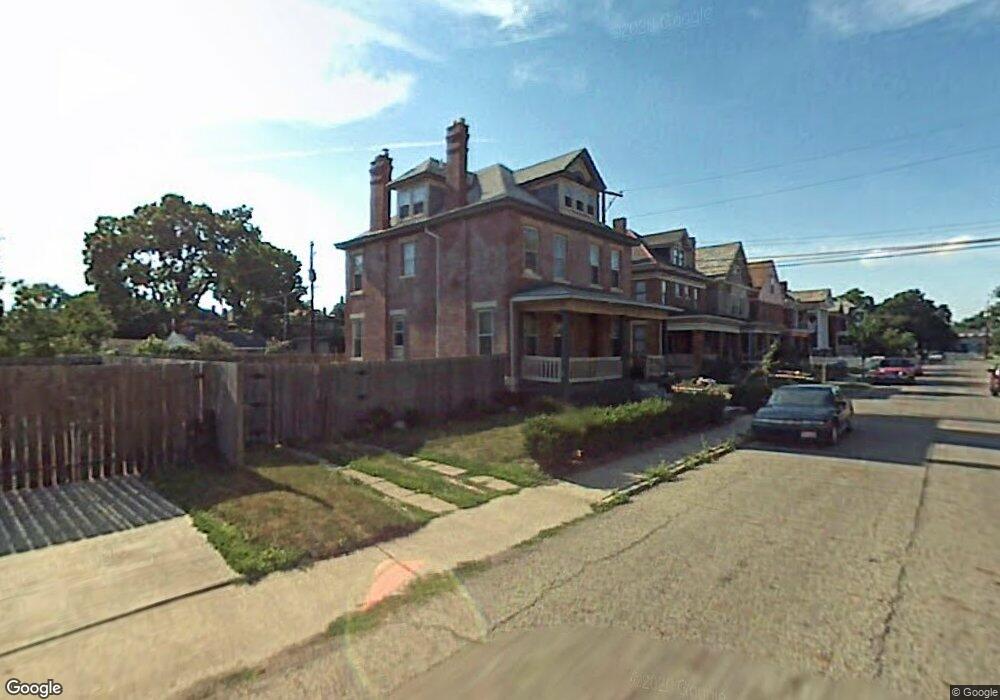
77 Sherman Ave Columbus, OH 43205
Olde Towne East NeighborhoodEstimated Value: $330,000 - $397,000
4
Beds
2
Baths
1,904
Sq Ft
$191/Sq Ft
Est. Value
About This Home
This home is located at 77 Sherman Ave, Columbus, OH 43205 and is currently estimated at $363,950, approximately $191 per square foot. 77 Sherman Ave is a home located in Franklin County with nearby schools including Ohio Avenue Elementary School, Champion Middle School, and East High School.
Ownership History
Date
Name
Owned For
Owner Type
Purchase Details
Closed on
Jul 28, 2005
Sold by
Wilson Charles E and Barry Julie
Bought by
Powers Travis J and Goushaw James M
Current Estimated Value
Purchase Details
Closed on
May 29, 1998
Sold by
Cedar Homes Inc
Bought by
Wilson Charles E and Barry Julie
Home Financials for this Owner
Home Financials are based on the most recent Mortgage that was taken out on this home.
Original Mortgage
$93,300
Outstanding Balance
$19,023
Interest Rate
7.27%
Mortgage Type
FHA
Estimated Equity
$344,927
Purchase Details
Closed on
Mar 17, 1994
Create a Home Valuation Report for This Property
The Home Valuation Report is an in-depth analysis detailing your home's value as well as a comparison with similar homes in the area
Home Values in the Area
Average Home Value in this Area
Purchase History
| Date | Buyer | Sale Price | Title Company |
|---|---|---|---|
| Powers Travis J | $162,000 | Amerititle | |
| Wilson Charles E | $77,400 | -- | |
| -- | -- | -- |
Source: Public Records
Mortgage History
| Date | Status | Borrower | Loan Amount |
|---|---|---|---|
| Open | Wilson Charles E | $93,300 |
Source: Public Records
Tax History Compared to Growth
Tax History
| Year | Tax Paid | Tax Assessment Tax Assessment Total Assessment is a certain percentage of the fair market value that is determined by local assessors to be the total taxable value of land and additions on the property. | Land | Improvement |
|---|---|---|---|---|
| 2024 | $4,296 | $95,730 | $29,540 | $66,190 |
| 2023 | $4,241 | $95,725 | $29,540 | $66,185 |
| 2022 | $3,542 | $68,290 | $6,510 | $61,780 |
| 2021 | $3,548 | $68,290 | $6,510 | $61,780 |
| 2020 | $3,553 | $68,290 | $6,510 | $61,780 |
| 2019 | $3,315 | $54,640 | $5,220 | $49,420 |
| 2018 | $1,654 | $54,640 | $5,220 | $49,420 |
| 2017 | $3,313 | $54,640 | $5,220 | $49,420 |
| 2016 | $3,585 | $54,120 | $4,240 | $49,880 |
| 2015 | $1,627 | $54,120 | $4,240 | $49,880 |
| 2014 | $3,233 | $53,630 | $4,240 | $49,390 |
| 2013 | $1,450 | $48,755 | $3,850 | $44,905 |
Source: Public Records
Map
Nearby Homes
- 1214 Madison Ave
- 1262 Fair Ave
- 122 S Ohio Ave Unit 2
- 1258 Oak St
- 127 S Ohio Ave Unit 19
- 1090 Fair Ave
- 1179 Franklin Ave
- 1070 Fair Ave
- 1096 Franklin Ave
- 1217 Franklin Ave Unit 219
- 1318 Oak St
- 1095 Franklin Ave
- 1093 Franklin Ave
- 181 S Ohio Ave
- 43 Winner Ave
- 1035 Madison Ave
- 1029 Franklin Ave
- 203-5 N 21st St Unit 203
- 233 S Ohio Ave Unit 11
- 1033-1035 Franklin Ave
- 1224 Fair Ave
- 73 Sherman Ave
- 1220 Fair Ave
- 1230 Fair Ave
- 69 Sherman Ave
- 1216 Fair Ave
- 65 Sherman Ave
- 1473 Sherman Ave
- 1244 Fair Ave
- 1212 Fair Ave
- 1225 Madison Ave
- 72 Sherman Ave
- 61 Sherman Ave
- 1223 Madison Ave
- 66 Sherman Ave
- 60 Sherman Ave Unit 62
- 1250 Fair Ave Unit 254
- 1250 Fair Ave Unit 4
- 1211 Madison Ave
- 1254 Fair Ave