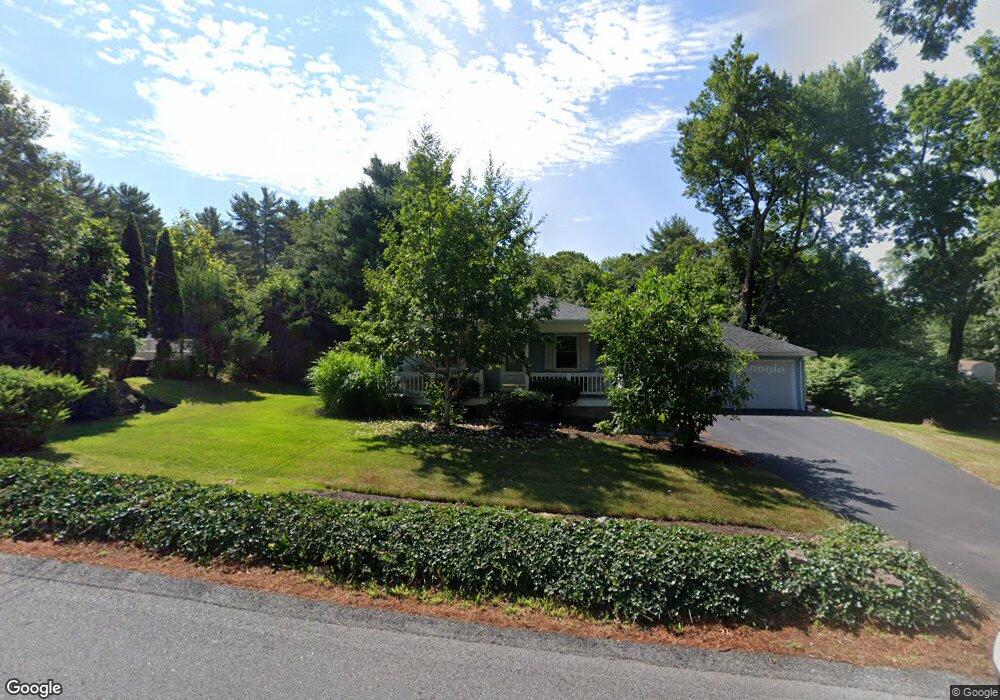
77 Spring St Foxboro, MA 02035
Estimated Value: $424,000 - $523,000
2
Beds
2
Baths
1,076
Sq Ft
$447/Sq Ft
Est. Value
About This Home
This home is located at 77 Spring St, Foxboro, MA 02035 and is currently estimated at $481,450, approximately $447 per square foot. 77 Spring St is a home located in Norfolk County with nearby schools including Foxborough High School, Foxborough Regional Charter School, and Hands-On-Montessori School.
Ownership History
Date
Name
Owned For
Owner Type
Purchase Details
Closed on
Mar 3, 2020
Sold by
Treweek James A
Bought by
James A Treweek T
Current Estimated Value
Purchase Details
Closed on
Dec 15, 2000
Sold by
Mcgrath Robert J and Mcgrath Annamarie
Bought by
Treweek James A and Treweek Kristin L
Home Financials for this Owner
Home Financials are based on the most recent Mortgage that was taken out on this home.
Original Mortgage
$139,600
Interest Rate
7.7%
Mortgage Type
Purchase Money Mortgage
Purchase Details
Closed on
Sep 15, 1992
Sold by
Dexter Paul B and Dexter Helen T
Bought by
Mcgrath Robert J and Mcgrath Annamarie
Home Financials for this Owner
Home Financials are based on the most recent Mortgage that was taken out on this home.
Original Mortgage
$112,000
Interest Rate
8.08%
Mortgage Type
Purchase Money Mortgage
Create a Home Valuation Report for This Property
The Home Valuation Report is an in-depth analysis detailing your home's value as well as a comparison with similar homes in the area
Home Values in the Area
Average Home Value in this Area
Purchase History
| Date | Buyer | Sale Price | Title Company |
|---|---|---|---|
| James A Treweek T | -- | None Available | |
| Treweek James A | $147,000 | -- | |
| Mcgrath Robert J | $124,700 | -- |
Source: Public Records
Mortgage History
| Date | Status | Borrower | Loan Amount |
|---|---|---|---|
| Previous Owner | Mcgrath Robert J | $139,600 | |
| Previous Owner | Mcgrath Robert J | $105,700 | |
| Previous Owner | Mcgrath Robert J | $112,000 |
Source: Public Records
Tax History
| Year | Tax Paid | Tax Assessment Tax Assessment Total Assessment is a certain percentage of the fair market value that is determined by local assessors to be the total taxable value of land and additions on the property. | Land | Improvement |
|---|---|---|---|---|
| 2025 | $5,018 | $379,600 | $201,900 | $177,700 |
| 2024 | $5,377 | $398,000 | $217,600 | $180,400 |
| 2023 | $5,268 | $370,700 | $207,200 | $163,500 |
| 2022 | $4,617 | $318,000 | $185,700 | $132,300 |
| 2021 | $4,842 | $328,500 | $176,400 | $152,100 |
| 2020 | $4,671 | $320,600 | $176,400 | $144,200 |
| 2019 | $4,198 | $285,600 | $176,900 | $108,700 |
| 2018 | $4,129 | $283,400 | $168,100 | $115,300 |
| 2017 | $4,220 | $280,600 | $165,300 | $115,300 |
| 2016 | $4,027 | $271,700 | $159,100 | $112,600 |
| 2015 | $3,588 | $236,200 | $118,600 | $117,600 |
| 2014 | $3,541 | $236,200 | $118,600 | $117,600 |
Source: Public Records
Map
Nearby Homes
- 619 N Main St
- 356 Central St
- 25 Kingman Ave
- 81 Chilson Ave
- 22 Pleasant St Unit B
- 233 Central St
- 266 N Main St Unit 3
- 166 Chauncy St
- 150 Rumford Ave Unit 110
- 122 Samoset Ave
- 46 Hope St
- 28 Court St
- 157 Central St
- 261 East St
- 13 Summerville Rd Unit 13
- 44 Fairfield Park Unit 44
- 9 Independence Dr Unit 9
- 97 East St
- 165 Chestnut St Unit 2
- 26 Fuller Rd Unit 6
Your Personal Tour Guide
Ask me questions while you tour the home.