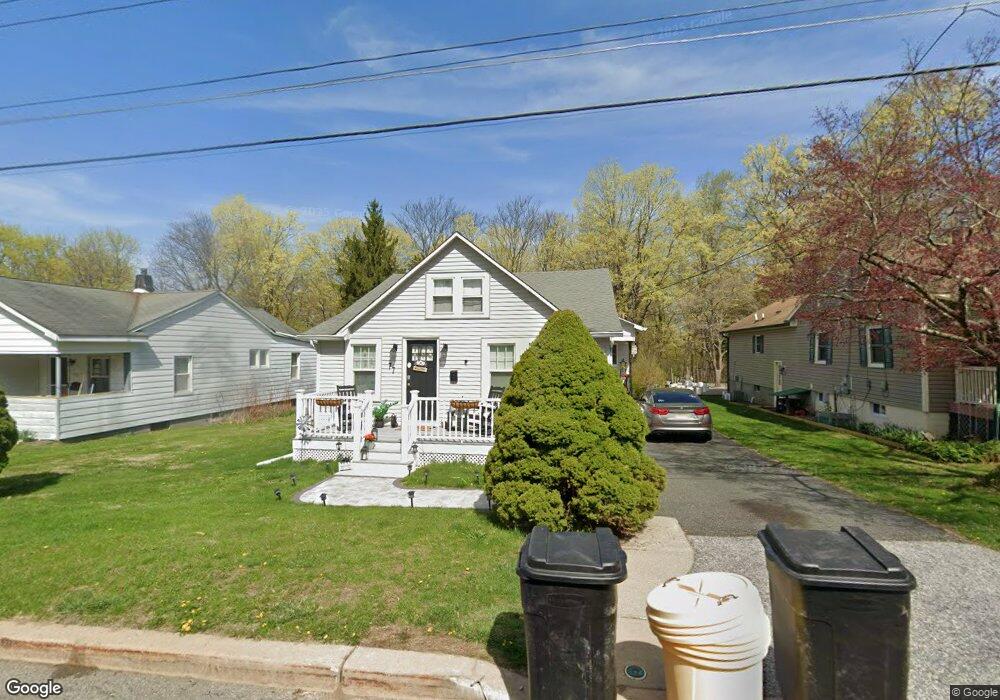
77 Sterling St Franklin, NJ 07416
Estimated Value: $319,000 - $365,000
--
Bed
--
Bath
1,244
Sq Ft
$278/Sq Ft
Est. Value
About This Home
This home is located at 77 Sterling St, Franklin, NJ 07416 and is currently estimated at $345,719, approximately $277 per square foot. 77 Sterling St is a home located in Sussex County with nearby schools including Franklin Elementary School, Wallkill Valley Regional High School, and Immaculate Conception Regional School.
Ownership History
Date
Name
Owned For
Owner Type
Purchase Details
Closed on
Aug 16, 2011
Sold by
Rude Richard James and Rude Lori Ann
Bought by
Crowell Charles and Crowell Rachel
Current Estimated Value
Home Financials for this Owner
Home Financials are based on the most recent Mortgage that was taken out on this home.
Original Mortgage
$142,500
Outstanding Balance
$98,895
Interest Rate
4.62%
Mortgage Type
VA
Estimated Equity
$246,824
Purchase Details
Closed on
Nov 6, 2007
Sold by
Reilly Marilyn and Duvall Val
Bought by
Rude Walter
Purchase Details
Closed on
May 10, 2007
Sold by
United States Of America
Bought by
Reilly Marilyn and Duvall Val
Purchase Details
Closed on
Mar 8, 2002
Sold by
Marion Stephen D and Marion Toni M
Bought by
Usda
Create a Home Valuation Report for This Property
The Home Valuation Report is an in-depth analysis detailing your home's value as well as a comparison with similar homes in the area
Home Values in the Area
Average Home Value in this Area
Purchase History
| Date | Buyer | Sale Price | Title Company |
|---|---|---|---|
| Crowell Charles | $150,000 | First American Title Ins Co | |
| Rude Walter | $227,000 | None Available | |
| Reilly Marilyn | $118,000 | Premium Title Service | |
| Usda | -- | -- |
Source: Public Records
Mortgage History
| Date | Status | Borrower | Loan Amount |
|---|---|---|---|
| Open | Crowell Charles | $142,500 |
Source: Public Records
Tax History Compared to Growth
Tax History
| Year | Tax Paid | Tax Assessment Tax Assessment Total Assessment is a certain percentage of the fair market value that is determined by local assessors to be the total taxable value of land and additions on the property. | Land | Improvement |
|---|---|---|---|---|
| 2025 | $6,473 | $271,800 | $100,400 | $171,400 |
| 2024 | $6,438 | $243,900 | $79,000 | $164,900 |
| 2023 | $6,438 | $233,500 | $73,300 | $160,200 |
| 2022 | $7,011 | $165,900 | $57,000 | $108,900 |
| 2021 | $6,751 | $164,500 | $57,000 | $107,500 |
| 2020 | $6,539 | $164,500 | $57,000 | $107,500 |
| 2019 | $6,243 | $164,500 | $57,000 | $107,500 |
| 2018 | $6,138 | $164,500 | $57,000 | $107,500 |
| 2017 | $5,988 | $164,500 | $57,000 | $107,500 |
| 2016 | $5,608 | $164,500 | $57,000 | $107,500 |
| 2015 | $5,626 | $164,500 | $57,000 | $107,500 |
| 2014 | $5,476 | $164,500 | $57,000 | $107,500 |
Source: Public Records
Map
Nearby Homes
- 66 Nestor St
- 6 South St
- 309 Rutherford Ave
- 112 Scott Rd
- 52 High St
- 20 High Point CI
- 23 Liberty Ln Unit W5
- 65 Scott Rd
- 76 Constitution Way Unit 76
- 76 Constitution Way Unit 534
- 26 Wyker Rd Unit A
- 26 Wyker Rd Unit 2207
- 45 Ben Franklin Dr Unit T1
- 580 State Rt 23
- 140 Wheatsworth Rd
- 8 Fowler St Unit 10
- 65 Buckwheat Rd
- 6 Mulberry St
- 212 New Jersey 23
- 50 Quarry Rd