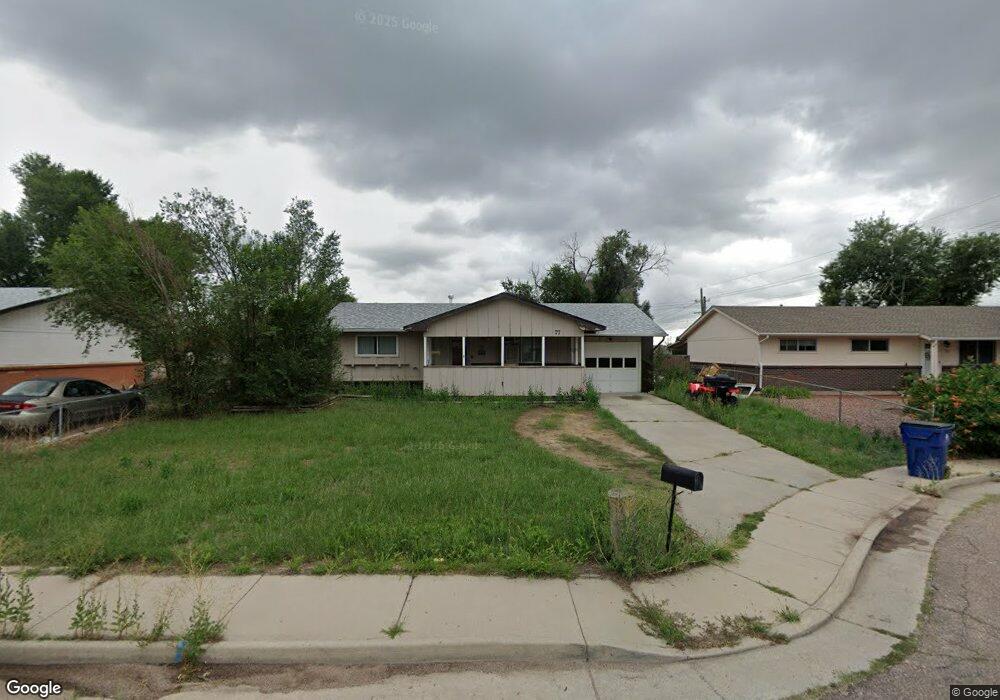
77 Sumac Dr Colorado Springs, CO 80911
Security-Widefield NeighborhoodEstimated Value: $321,018 - $374,000
4
Beds
3
Baths
913
Sq Ft
$370/Sq Ft
Est. Value
About This Home
This home is located at 77 Sumac Dr, Colorado Springs, CO 80911 and is currently estimated at $338,255, approximately $370 per square foot. 77 Sumac Dr is a home located in El Paso County with nearby schools including Pinello Elementary School, Sproul Junior High School, and Widefield High School.
Ownership History
Date
Name
Owned For
Owner Type
Purchase Details
Closed on
May 15, 2023
Sold by
Barriera Erik
Bought by
Tekubie Jodi and Barriera Erik
Current Estimated Value
Purchase Details
Closed on
Jul 13, 2016
Sold by
Demars Daniel C
Bought by
Barriera Erik
Home Financials for this Owner
Home Financials are based on the most recent Mortgage that was taken out on this home.
Original Mortgage
$166,429
Interest Rate
4.4%
Mortgage Type
FHA
Purchase Details
Closed on
Jul 15, 2011
Sold by
Ramrod Investments Llc
Bought by
Demars Daniel C
Home Financials for this Owner
Home Financials are based on the most recent Mortgage that was taken out on this home.
Original Mortgage
$151,182
Interest Rate
4.55%
Mortgage Type
VA
Purchase Details
Closed on
Apr 7, 2011
Sold by
Secretary Of Housing & Urban Development
Bought by
Ramrod Investments Llc
Purchase Details
Closed on
Aug 19, 2010
Sold by
Williams Bianka M
Bought by
Secretary Of Housing & Urban Development
Purchase Details
Closed on
Aug 27, 2007
Sold by
Ritterbush Diane Rene and Lavengood John Steven
Bought by
Williams Bianka M
Home Financials for this Owner
Home Financials are based on the most recent Mortgage that was taken out on this home.
Original Mortgage
$147,175
Interest Rate
6.72%
Mortgage Type
FHA
Purchase Details
Closed on
Aug 13, 2007
Sold by
Ritterbush Diane Rene and Lavengood John Steven
Bought by
Ritterbush Diane Rene and Lavengood John Steven
Home Financials for this Owner
Home Financials are based on the most recent Mortgage that was taken out on this home.
Original Mortgage
$147,175
Interest Rate
6.72%
Mortgage Type
FHA
Purchase Details
Closed on
Aug 2, 2007
Sold by
Ritterbush Diane Rene and Lavengood John Steven
Bought by
Ritterbush Diane Rene and Lavengood John Steven
Home Financials for this Owner
Home Financials are based on the most recent Mortgage that was taken out on this home.
Original Mortgage
$147,175
Interest Rate
6.72%
Mortgage Type
FHA
Purchase Details
Closed on
Mar 12, 2004
Sold by
Lavengood Joyce Charlene
Bought by
Ritterbush Diane Rene and Lavengood John Steven
Create a Home Valuation Report for This Property
The Home Valuation Report is an in-depth analysis detailing your home's value as well as a comparison with similar homes in the area
Home Values in the Area
Average Home Value in this Area
Purchase History
| Date | Buyer | Sale Price | Title Company |
|---|---|---|---|
| Tekubie Jodi | -- | None Listed On Document | |
| Barriera Erik | $169,500 | Unified Title Co Inc | |
| Demars Daniel C | $148,000 | Cb Title | |
| Ramrod Investments Llc | $78,405 | Ats | |
| Secretary Of Housing & Urban Development | -- | None Available | |
| Williams Bianka M | $150,000 | Title America | |
| Ritterbush Diane Rene | -- | None Available | |
| Ritterbush Diane Rene | -- | None Available | |
| Ritterbush Diane Rene | -- | -- |
Source: Public Records
Mortgage History
| Date | Status | Borrower | Loan Amount |
|---|---|---|---|
| Previous Owner | Barriera Erik | $166,429 | |
| Previous Owner | Demars Daniel C | $151,182 | |
| Previous Owner | Williams Bianka M | $147,175 |
Source: Public Records
Tax History Compared to Growth
Tax History
| Year | Tax Paid | Tax Assessment Tax Assessment Total Assessment is a certain percentage of the fair market value that is determined by local assessors to be the total taxable value of land and additions on the property. | Land | Improvement |
|---|---|---|---|---|
| 2025 | $1,550 | $24,660 | -- | -- |
| 2024 | $1,490 | $24,620 | $3,220 | $21,400 |
| 2023 | $1,490 | $24,620 | $3,220 | $21,400 |
| 2022 | $1,394 | $18,670 | $2,220 | $16,450 |
| 2021 | $1,503 | $19,210 | $2,290 | $16,920 |
| 2020 | $1,172 | $14,550 | $2,000 | $12,550 |
| 2019 | $1,165 | $14,550 | $2,000 | $12,550 |
| 2018 | $1,032 | $12,020 | $1,500 | $10,520 |
| 2017 | $1,043 | $12,020 | $1,500 | $10,520 |
| 2016 | $851 | $11,980 | $1,590 | $10,390 |
| 2015 | $873 | $11,980 | $1,590 | $10,390 |
| 2014 | $816 | $11,240 | $1,430 | $9,810 |
Source: Public Records
Map
Nearby Homes