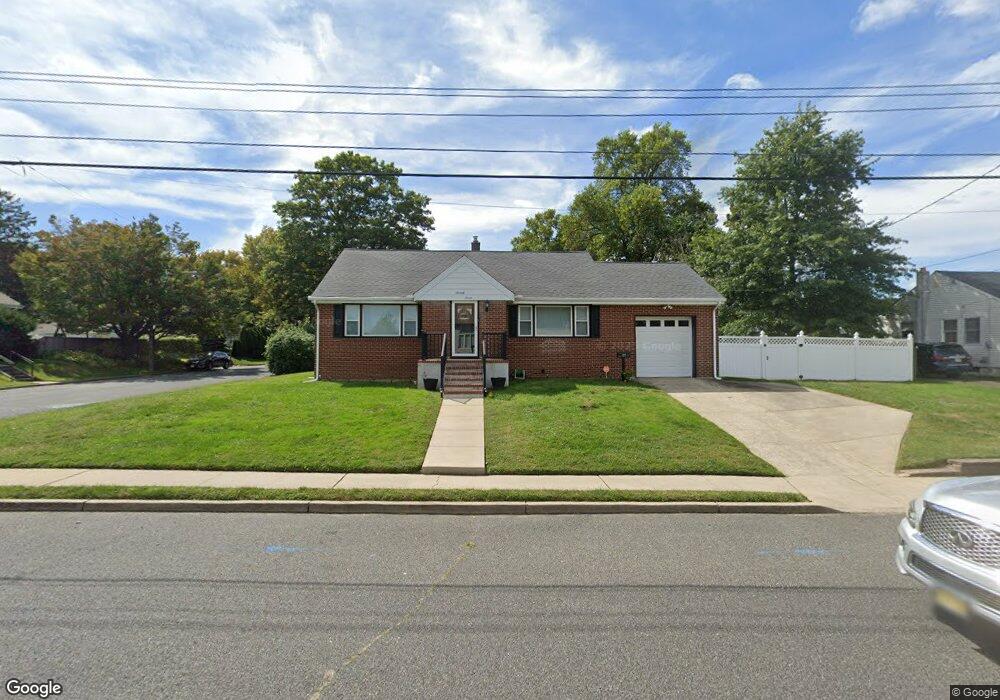
77 Victor Ave West Long Branch, NJ 07764
Estimated Value: $547,000 - $615,000
2
Beds
2
Baths
1,180
Sq Ft
$493/Sq Ft
Est. Value
About This Home
This home is located at 77 Victor Ave, West Long Branch, NJ 07764 and is currently estimated at $581,547, approximately $492 per square foot. 77 Victor Ave is a home located in Monmouth County with nearby schools including Betty McElmon Elementary School, Frank Antonides School, and Shore Regional High School.
Ownership History
Date
Name
Owned For
Owner Type
Purchase Details
Closed on
Jul 24, 2009
Sold by
Reid Marilyn R and Reid Anthony
Bought by
Randolph Elizabeth
Current Estimated Value
Purchase Details
Closed on
May 13, 2004
Sold by
Mercurio Deborah
Bought by
Wall Linda
Home Financials for this Owner
Home Financials are based on the most recent Mortgage that was taken out on this home.
Original Mortgage
$205,000
Interest Rate
6.32%
Purchase Details
Closed on
Jun 30, 1995
Sold by
Mulligan Timothy
Bought by
Mercurio Joseph and Murcurio Arline
Create a Home Valuation Report for This Property
The Home Valuation Report is an in-depth analysis detailing your home's value as well as a comparison with similar homes in the area
Home Values in the Area
Average Home Value in this Area
Purchase History
| Date | Buyer | Sale Price | Title Company |
|---|---|---|---|
| Randolph Elizabeth | -- | None Available | |
| Wall Linda | $280,000 | -- | |
| Mercurio Joseph | $130,000 | -- |
Source: Public Records
Mortgage History
| Date | Status | Borrower | Loan Amount |
|---|---|---|---|
| Previous Owner | Wall Linda | $205,000 |
Source: Public Records
Tax History Compared to Growth
Tax History
| Year | Tax Paid | Tax Assessment Tax Assessment Total Assessment is a certain percentage of the fair market value that is determined by local assessors to be the total taxable value of land and additions on the property. | Land | Improvement |
|---|---|---|---|---|
| 2025 | $6,924 | $536,300 | $333,900 | $202,400 |
| 2024 | $6,847 | $531,400 | $320,000 | $211,400 |
| 2023 | $6,847 | $490,100 | $283,600 | $206,500 |
| 2022 | $6,342 | $458,100 | $258,600 | $199,500 |
| 2021 | $6,342 | $328,100 | $173,500 | $154,600 |
| 2020 | $6,157 | $299,600 | $148,500 | $151,100 |
| 2019 | $6,312 | $308,800 | $158,600 | $150,200 |
| 2018 | $5,997 | $283,400 | $140,200 | $143,200 |
| 2017 | $5,926 | $267,400 | $128,500 | $138,900 |
| 2016 | $5,799 | $267,000 | $136,900 | $130,100 |
| 2015 | $5,733 | $263,600 | $136,900 | $126,700 |
| 2014 | $6,166 | $264,500 | $143,600 | $120,900 |
Source: Public Records
Map
Nearby Homes