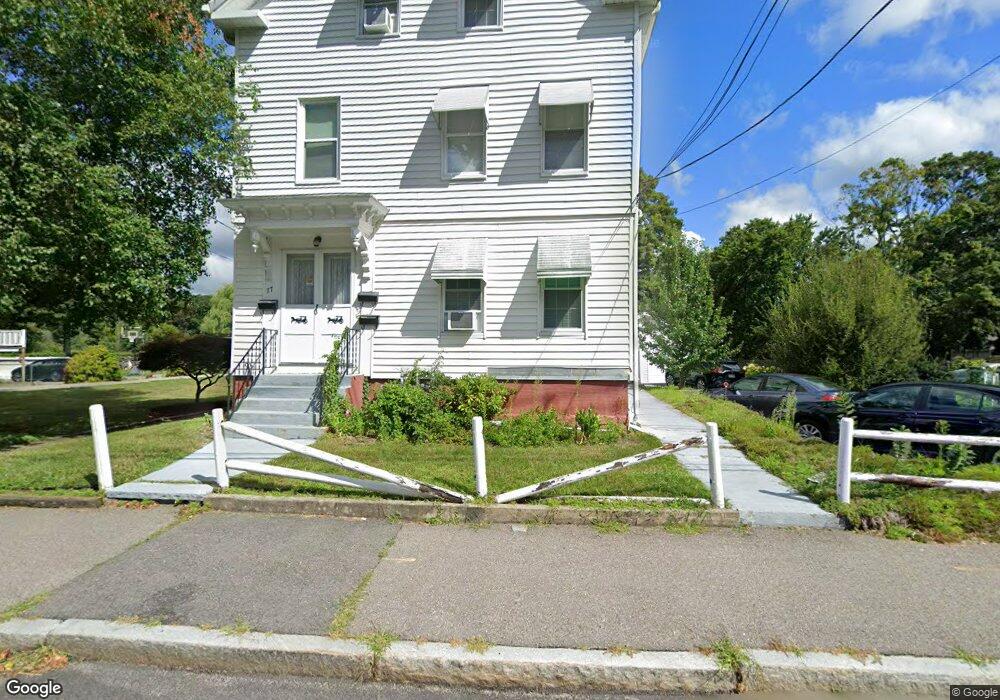
77 West St Unit 1 North Attleboro, MA 02760
North Attleboro NeighborhoodEstimated Value: $627,815 - $727,000
2
Beds
1
Bath
1,000
Sq Ft
$673/Sq Ft
Est. Value
About This Home
This home is located at 77 West St Unit 1, North Attleboro, MA 02760 and is currently estimated at $672,954, approximately $672 per square foot. 77 West St Unit 1 is a home located in Bristol County with nearby schools including North Attleboro High School.
Ownership History
Date
Name
Owned For
Owner Type
Purchase Details
Closed on
Nov 17, 2017
Sold by
Lynn Josephine S and Lynn Theodore W
Bought by
Fitton Jeremy L
Current Estimated Value
Home Financials for this Owner
Home Financials are based on the most recent Mortgage that was taken out on this home.
Original Mortgage
$343,660
Outstanding Balance
$287,971
Interest Rate
3.85%
Mortgage Type
FHA
Estimated Equity
$384,983
Create a Home Valuation Report for This Property
The Home Valuation Report is an in-depth analysis detailing your home's value as well as a comparison with similar homes in the area
Home Values in the Area
Average Home Value in this Area
Purchase History
| Date | Buyer | Sale Price | Title Company |
|---|---|---|---|
| Fitton Jeremy L | $350,000 | -- |
Source: Public Records
Mortgage History
| Date | Status | Borrower | Loan Amount |
|---|---|---|---|
| Open | Fitton Jeremy L | $343,660 |
Source: Public Records
Tax History Compared to Growth
Tax History
| Year | Tax Paid | Tax Assessment Tax Assessment Total Assessment is a certain percentage of the fair market value that is determined by local assessors to be the total taxable value of land and additions on the property. | Land | Improvement |
|---|---|---|---|---|
| 2025 | $6,177 | $523,900 | $128,700 | $395,200 |
| 2024 | $6,046 | $523,900 | $128,700 | $395,200 |
| 2023 | $6,350 | $496,500 | $128,700 | $367,800 |
| 2022 | $5,990 | $430,000 | $128,700 | $301,300 |
| 2021 | $3,957 | $416,700 | $128,700 | $288,000 |
| 2020 | $4,878 | $339,900 | $128,700 | $211,200 |
| 2019 | $3,852 | $332,600 | $117,000 | $215,600 |
| 2018 | $3,729 | $332,600 | $117,000 | $215,600 |
| 2017 | $4,106 | $310,600 | $117,000 | $193,600 |
| 2016 | $4,016 | $303,800 | $129,900 | $173,900 |
| 2015 | $3,875 | $294,900 | $136,400 | $158,500 |
| 2014 | $3,826 | $289,000 | $126,100 | $162,900 |
Source: Public Records
Map
Nearby Homes
- 20 South St
- 35-R Whiting St
- 45 Moran St
- 64 Smith St
- 68 Fisher St
- 19 Church St Unit A5
- 16 Elizabeth St
- 8 Al Pace Dr Unit 8
- 188 Smith St
- 85 Richards Ave
- 16 Richards Ave Unit 106
- 93 Bank St
- 212 Fisher St Unit A5
- 1066 Mount Hope St
- 217 Fisher St
- 99 Arnold Rd
- 880 Landry Ave Unit 2
- 0 Landry 2nd Unit 73350867
- 145 W Bacon St
- 42 2nd Ave Unit 24