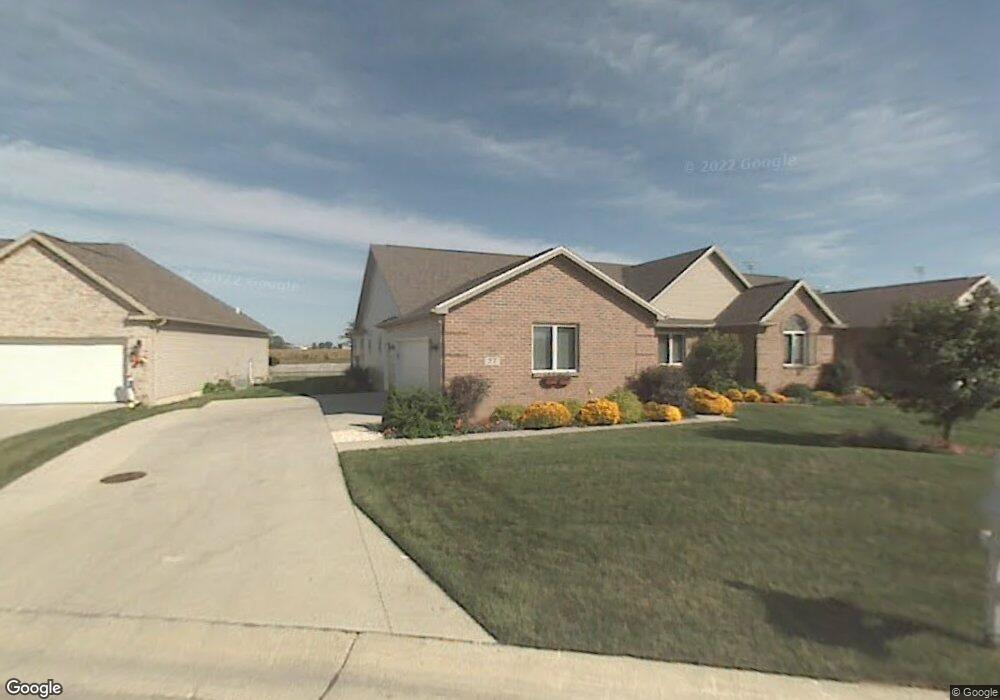
77 Windrush Bourne Bowling Green, OH 43402
Estimated Value: $310,000 - $446,000
3
Beds
3
Baths
1,807
Sq Ft
$195/Sq Ft
Est. Value
About This Home
This home is located at 77 Windrush Bourne, Bowling Green, OH 43402 and is currently estimated at $352,229, approximately $194 per square foot. 77 Windrush Bourne is a home located in Wood County with nearby schools including Bowling Green High School, Bowling Green Christian Academy, and Montessori School Of Bowling Green.
Ownership History
Date
Name
Owned For
Owner Type
Purchase Details
Closed on
Apr 26, 2018
Sold by
Ungerer Gary A and Ungerer Cytnhia C
Bought by
Rood Jared and Cook Bonnie
Current Estimated Value
Purchase Details
Closed on
Jul 24, 2009
Sold by
Ungerer Gary A and Ungerer Cynthia C
Bought by
Ungerer Gary A and Ungerer Cynthia C
Purchase Details
Closed on
Jun 30, 2005
Sold by
Fligor Dennis L and Fligor Patricia L
Bought by
Ungerer Gary A and Ungerer Patricia Sue
Home Financials for this Owner
Home Financials are based on the most recent Mortgage that was taken out on this home.
Original Mortgage
$179,900
Outstanding Balance
$95,120
Interest Rate
5.86%
Mortgage Type
Fannie Mae Freddie Mac
Estimated Equity
$257,109
Purchase Details
Closed on
May 11, 2001
Sold by
Szana Robert J and Szana Helen E
Bought by
Fligor Dennis L and Fligor Patricia L
Purchase Details
Closed on
Mar 30, 2000
Sold by
Northwest Title Agency Of Ohio & Mi Inc
Bought by
Szana Robert J and Szana Helen E
Create a Home Valuation Report for This Property
The Home Valuation Report is an in-depth analysis detailing your home's value as well as a comparison with similar homes in the area
Home Values in the Area
Average Home Value in this Area
Purchase History
| Date | Buyer | Sale Price | Title Company |
|---|---|---|---|
| Rood Jared | $250,166 | None Available | |
| Ungerer Gary A | -- | Attorney | |
| Ungerer Gary A | $239,900 | American Title Agency | |
| Fligor Dennis L | $38,500 | Northwest Title Agency Of Oh | |
| Szana Robert J | $35,900 | Northwest Title Agency Of Oh |
Source: Public Records
Mortgage History
| Date | Status | Borrower | Loan Amount |
|---|---|---|---|
| Open | Ungerer Gary A | $179,900 | |
| Closed | Ungerer Gary A | $33,500 |
Source: Public Records
Tax History Compared to Growth
Tax History
| Year | Tax Paid | Tax Assessment Tax Assessment Total Assessment is a certain percentage of the fair market value that is determined by local assessors to be the total taxable value of land and additions on the property. | Land | Improvement |
|---|---|---|---|---|
| 2024 | $4,001 | $92,750 | $14,210 | $78,540 |
| 2023 | $4,001 | $92,750 | $14,210 | $78,540 |
| 2021 | $3,502 | $80,820 | $14,000 | $66,820 |
| 2020 | $3,511 | $80,820 | $14,000 | $66,820 |
| 2019 | $3,131 | $68,670 | $14,000 | $54,670 |
| 2018 | $3,112 | $68,670 | $14,000 | $54,670 |
| 2017 | $3,076 | $68,670 | $14,000 | $54,670 |
| 2016 | $3,114 | $66,990 | $14,000 | $52,990 |
| 2015 | $3,114 | $66,990 | $14,000 | $52,990 |
| 2014 | $3,211 | $66,990 | $14,000 | $52,990 |
| 2013 | $3,454 | $66,990 | $14,000 | $52,990 |
Source: Public Records
Map
Nearby Homes
- 707 W Poe Rd
- 29 Darlyn Dr
- Daffodil II Plan at Aspire at Toussaint Springs
- Water Lily Plan at Aspire at Toussaint Springs
- Oleander Plan at Aspire at Toussaint Springs
- Sweet Pea Plan at Aspire at Toussaint Springs
- Forsythia Plan at Aspire at Toussaint Springs
- Goldenrod Plan at Aspire at Toussaint Springs
- 1206 N Dixie Hwy
- 1124 Raven Rd
- 958 N Dixie Hwy
- 1048 N Main St Unit 56
- 1048 N Main St Unit 37
- 1048 N Main St Unit 103
- 1048 N Main St Unit 46
- 315 Parkview Dr
- 1303 Finch Dr
- 915 Manitoba Dr
- 927 Darter Dr
- 928 Darter Dr
- 78 Windrush Bourne
- 76 Windrush Bourne
- 75 Windrush Bourne
- 74 Windrush Bourne
- 68 Nottingham Cross
- 67 Windrush Bourne
- 79 Nottingham Cross
- 73 Windrush Bourne
- 80 Nottingham Cross
- 66 Windrush Bourne
- 90 Nottingham Cross
- 89 Nottingham Cross
- 65 Windrush Bourne
- 72 Windrush Bourne
- 91 Nottingham Cross
- 88 Nottingham Cross
- 64 Windrush Bourne
- 71 Windrush Bourne
- 63 Windrush Bourne
- 70 Windrush Bourne