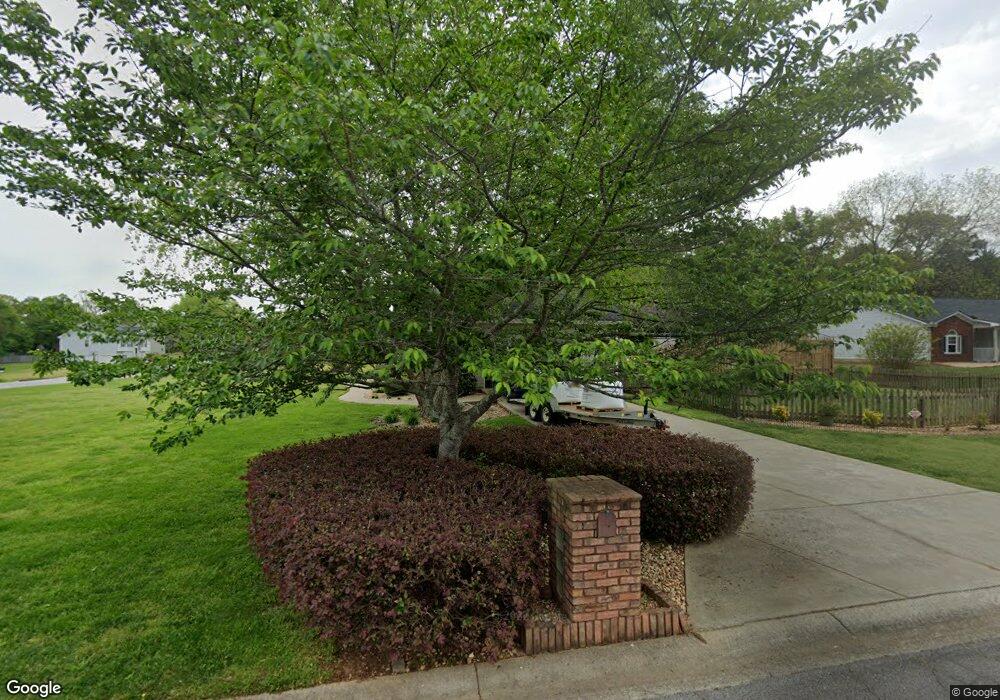
770 Brookelynn Trace Bethlehem, GA 30620
Estimated Value: $330,100 - $370,000
Studio
3
Baths
2,225
Sq Ft
$161/Sq Ft
Est. Value
About This Home
This home is located at 770 Brookelynn Trace, Bethlehem, GA 30620 and is currently estimated at $357,525, approximately $160 per square foot. 770 Brookelynn Trace is a home located in Barrow County with nearby schools including Yargo Elementary School, Haymon-Morris Middle School, and Apalachee High School.
Ownership History
Date
Name
Owned For
Owner Type
Purchase Details
Closed on
Jan 15, 1999
Sold by
Camadeca Joseph W
Bought by
Camadeca Joseph W
Current Estimated Value
Home Financials for this Owner
Home Financials are based on the most recent Mortgage that was taken out on this home.
Original Mortgage
$105,000
Outstanding Balance
$22,632
Interest Rate
6.72%
Mortgage Type
New Conventional
Estimated Equity
$334,893
Purchase Details
Closed on
Sep 19, 1997
Sold by
Creekview Bldrs
Bought by
Camadeca Joseph W
Home Financials for this Owner
Home Financials are based on the most recent Mortgage that was taken out on this home.
Original Mortgage
$102,250
Interest Rate
7.46%
Mortgage Type
FHA
Purchase Details
Closed on
May 20, 1997
Sold by
C G S Development In
Bought by
Creekview Builders N
Purchase Details
Closed on
Jul 9, 1996
Bought by
C G S Development In
Create a Home Valuation Report for This Property
The Home Valuation Report is an in-depth analysis detailing your home's value as well as a comparison with similar homes in the area
Home Values in the Area
Average Home Value in this Area
Purchase History
| Date | Buyer | Sale Price | Title Company |
|---|---|---|---|
| Camadeca Joseph W | -- | -- | |
| Camadeca Joseph W | $115,900 | -- | |
| Creekview Builders N | $36,000 | -- | |
| C G S Development In | $678,600 | -- |
Source: Public Records
Mortgage History
| Date | Status | Borrower | Loan Amount |
|---|---|---|---|
| Open | Camadeca Joseph W | $105,000 | |
| Previous Owner | Camadeca Joseph W | $102,250 |
Source: Public Records
Tax History
| Year | Tax Paid | Tax Assessment Tax Assessment Total Assessment is a certain percentage of the fair market value that is determined by local assessors to be the total taxable value of land and additions on the property. | Land | Improvement |
|---|---|---|---|---|
| 2025 | $2,756 | $118,246 | $26,800 | $91,446 |
| 2024 | $2,821 | $115,554 | $26,800 | $88,754 |
| 2023 | $2,410 | $115,954 | $26,800 | $89,154 |
| 2022 | $2,711 | $96,538 | $22,400 | $74,138 |
| 2021 | $2,671 | $90,138 | $16,000 | $74,138 |
| 2020 | $2,146 | $72,435 | $16,000 | $56,435 |
| 2019 | $2,182 | $72,435 | $16,000 | $56,435 |
| 2018 | $2,071 | $69,635 | $13,200 | $56,435 |
| 2017 | $1,755 | $60,291 | $13,200 | $47,091 |
| 2016 | $1,518 | $52,528 | $13,200 | $39,328 |
| 2015 | $1,539 | $52,986 | $13,200 | $39,786 |
| 2014 | $1,365 | $46,713 | $6,468 | $40,245 |
| 2013 | -- | $44,231 | $6,468 | $37,763 |
Source: Public Records
Map
Nearby Homes
- 209 Angie Way
- 1256 Loganville Hwy
- 1129 Loganville Hwy
- 907 Downing Dr
- 627 Bridle Creek Dr
- 923 Downing Dr
- 1188 Carl-Bethlehem Rd
- 449 Carl Bethlehem Rd SW
- 611 Mcdowell Ln
- 1202 Benton Ct
- 732 Ridgeland Rd
- 738 Worth Ct
- 724 Westbury Dr
- 1309 Tom Miller Rd
- 236 Vision St
- 176 Market St
- 713 Carl Bethlehem Rd
- 14 Smithwood Dr
- 631 Saddle Ridge Dr
- 253 Meadows Dr
- 774 Brookelynn Trace
- 179 Cole Cir Unit 1
- 171 Cole Cir
- 174 Cole Cir Unit 1
- 776 Brookelynn Trace
- 183 Cole Cir
- 178 Cole Cir
- 172 Cole Cir Unit 10
- 172 Cole Cir Unit 1
- 169 Cole Cir
- 169 Cole Cir Unit 1
- 201 Angie Way Unit 2
- 170 Cole Cir
- 778 Brookelynn Trace
- 778 Brookelyn Trace
- 185 Cole Cir
- 184 Cole Cir
- 203 Angie Way
- 167 Cole Cir
- 1461 Dillard Heights Dr
Your Personal Tour Guide
Ask me questions while you tour the home.