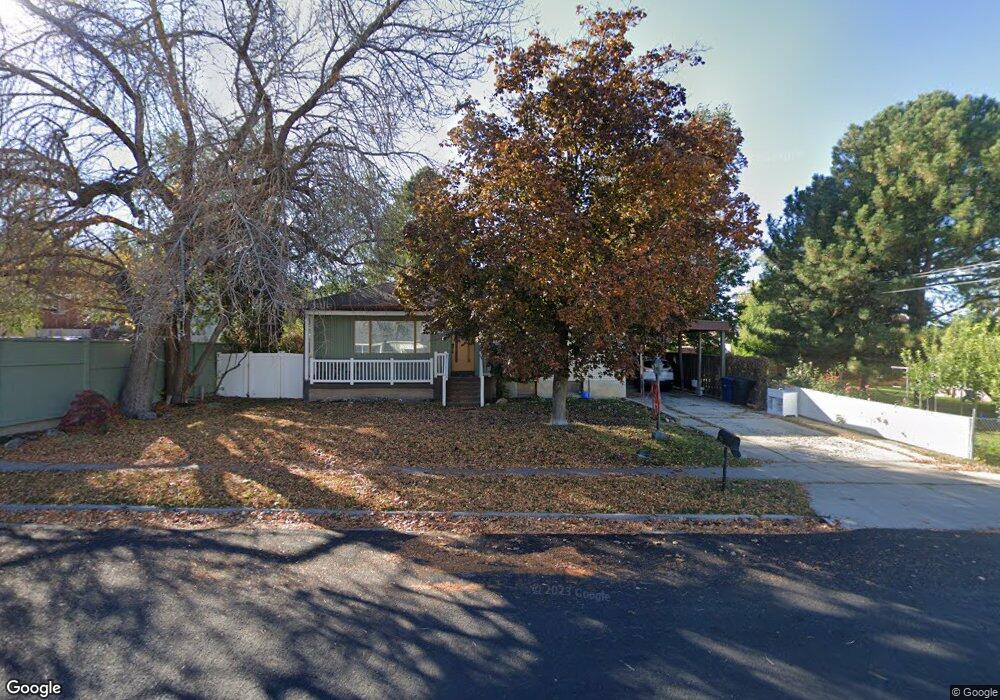
770 E 100 N Spanish Fork, UT 84660
Estimated Value: $442,000 - $520,000
4
Beds
2
Baths
1,520
Sq Ft
$321/Sq Ft
Est. Value
About This Home
This home is located at 770 E 100 N, Spanish Fork, UT 84660 and is currently estimated at $487,784, approximately $320 per square foot. 770 E 100 N is a home located in Utah County with nearby schools including Park Elementary School, Diamond Fork Junior High School, and Spanish Fork Jr High School.
Ownership History
Date
Name
Owned For
Owner Type
Purchase Details
Closed on
Feb 14, 2014
Sold by
Peterson Shane
Bought by
Peterson Shane and Peterson Amanda N
Current Estimated Value
Home Financials for this Owner
Home Financials are based on the most recent Mortgage that was taken out on this home.
Original Mortgage
$164,326
Interest Rate
4.12%
Mortgage Type
FHA
Purchase Details
Closed on
Sep 11, 2001
Sold by
Peterson Lavee W
Bought by
Peterson Chris
Home Financials for this Owner
Home Financials are based on the most recent Mortgage that was taken out on this home.
Original Mortgage
$108,000
Interest Rate
7%
Create a Home Valuation Report for This Property
The Home Valuation Report is an in-depth analysis detailing your home's value as well as a comparison with similar homes in the area
Home Values in the Area
Average Home Value in this Area
Purchase History
| Date | Buyer | Sale Price | Title Company |
|---|---|---|---|
| Peterson Shane | -- | None Available | |
| Peterson Shane | -- | None Available | |
| Peterson Chris | -- | Metro National Title |
Source: Public Records
Mortgage History
| Date | Status | Borrower | Loan Amount |
|---|---|---|---|
| Closed | Peterson Shane | $164,326 | |
| Closed | Peterson Chris | $108,000 |
Source: Public Records
Tax History Compared to Growth
Tax History
| Year | Tax Paid | Tax Assessment Tax Assessment Total Assessment is a certain percentage of the fair market value that is determined by local assessors to be the total taxable value of land and additions on the property. | Land | Improvement |
|---|---|---|---|---|
| 2025 | $1,996 | $233,805 | $158,800 | $266,300 |
| 2024 | $1,996 | $205,755 | $0 | $0 |
| 2023 | $2,012 | $207,570 | $0 | $0 |
| 2022 | $2,085 | $210,980 | $0 | $0 |
| 2021 | $1,854 | $300,200 | $92,000 | $208,200 |
| 2020 | $1,679 | $264,300 | $76,700 | $187,600 |
| 2019 | $1,492 | $247,100 | $76,700 | $170,400 |
| 2018 | $1,405 | $224,900 | $76,700 | $148,200 |
| 2017 | $1,241 | $106,810 | $0 | $0 |
| 2016 | $1,033 | $87,725 | $0 | $0 |
| 2015 | $1,031 | $86,460 | $0 | $0 |
| 2014 | $979 | $82,445 | $0 | $0 |
Source: Public Records
Map
Nearby Homes
- 653 E 200 N
- 270 N 500 E
- 306 N 1070 E
- 306 N 1070 E Unit 17
- 291 S 700 E
- 314 N 1070 E
- 233 N 1120 E
- 1024 E 260 N Unit 18
- 1006 E 260 N Unit 17
- 998 E 260 N Unit 16
- 992 E 260 N Unit 15
- 1102 E 120 S
- 284 N 400 E
- 66 Southgate Loop
- 333 S 800 E
- 1083 E 400 N
- 139 S 300 E
- 969 E 550 N
- 2998 Canyon Dr Unit 333
- 3014 Canyon Dr Unit 332