Estimated Value: $591,000 - $638,000
5
Beds
3
Baths
2,500
Sq Ft
$244/Sq Ft
Est. Value
About This Home
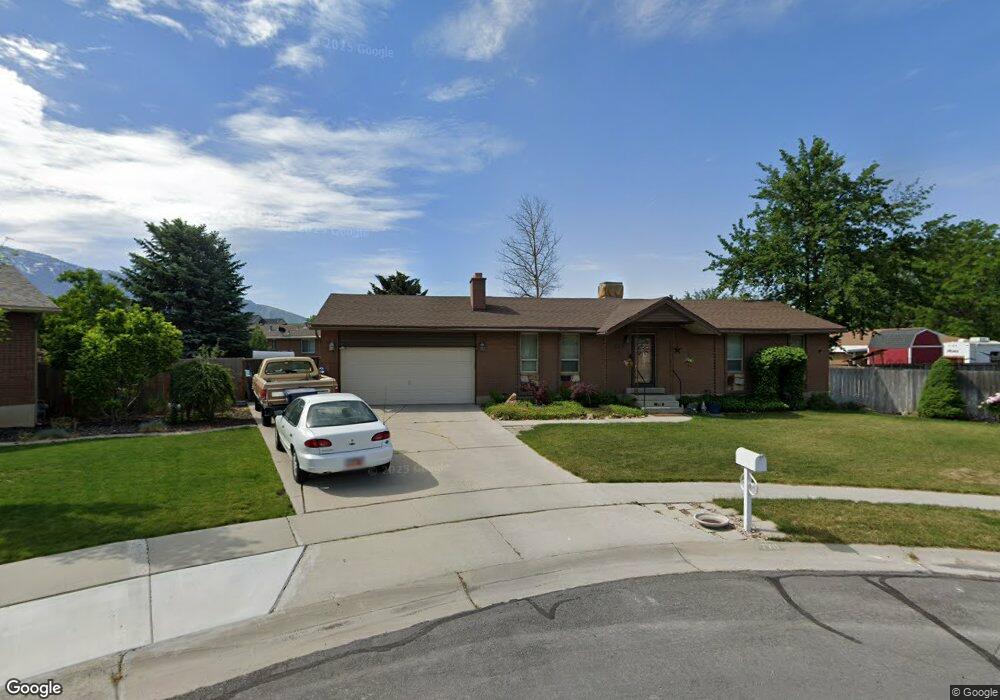
This home is located at 770 E Pinewood Cir, Sandy, UT 84094 and is currently estimated at $610,376, approximately $244 per square foot. 770 E Pinewood Cir is a home located in Salt Lake County with nearby schools including East Sandy School, Union Middle School, and Hillcrest High School.
Ownership History
Date
Name
Owned For
Owner Type
Purchase Details
Closed on
Sep 20, 2024
Sold by
Paxton Denise
Bought by
Denise Paxton Revocable Living Trust and Paxton
Current Estimated Value
Purchase Details
Closed on
Nov 20, 2003
Sold by
Armstrong Harold H and Armstrong Andrea M
Bought by
Paxton Paul and Paxton Denise
Home Financials for this Owner
Home Financials are based on the most recent Mortgage that was taken out on this home.
Original Mortgage
$165,000
Interest Rate
5.89%
Mortgage Type
Purchase Money Mortgage
Purchase Details
Closed on
Feb 8, 1999
Sold by
Kennedy Keith B and Kennedy Jolynn M
Bought by
Armstrong Harold H and Armstrong Andrea M
Home Financials for this Owner
Home Financials are based on the most recent Mortgage that was taken out on this home.
Original Mortgage
$157,590
Interest Rate
7%
Mortgage Type
VA
Create a Home Valuation Report for This Property
The Home Valuation Report is an in-depth analysis detailing your home's value as well as a comparison with similar homes in the area
Home Values in the Area
Average Home Value in this Area
Purchase History
| Date | Buyer | Sale Price | Title Company |
|---|---|---|---|
| Denise Paxton Revocable Living Trust | -- | None Listed On Document | |
| Paxton Paul | -- | -- | |
| Armstrong Harold H | -- | United Title Services |
Source: Public Records
Mortgage History
| Date | Status | Borrower | Loan Amount |
|---|---|---|---|
| Previous Owner | Paxton Paul | $165,000 | |
| Previous Owner | Armstrong Harold H | $157,590 |
Source: Public Records
Tax History
| Year | Tax Paid | Tax Assessment Tax Assessment Total Assessment is a certain percentage of the fair market value that is determined by local assessors to be the total taxable value of land and additions on the property. | Land | Improvement |
|---|---|---|---|---|
| 2025 | $3,185 | $585,900 | $170,700 | $415,200 |
| 2024 | $3,185 | $588,300 | $164,200 | $424,100 |
| 2023 | $3,144 | $579,100 | $156,100 | $423,000 |
| 2022 | $2,875 | $517,900 | $153,000 | $364,900 |
| 2021 | $2,413 | $369,300 | $118,900 | $250,400 |
| 2020 | $2,335 | $337,200 | $118,900 | $218,300 |
| 2019 | $2,247 | $316,000 | $112,200 | $203,800 |
| 2016 | $1,921 | $259,900 | $112,200 | $147,700 |
Source: Public Records
Map
Nearby Homes
- 760 E 8080 S
- 798 E Spruce Tree Ln
- 7819 S Spruce Tree Ln
- 8087 S 615 E
- 7899 S 930 E
- 7692 Chad St
- 8268 S 865 E
- 600 E Briarsprings Cir
- 954 E 7725 S
- 7640 S Quail Springs Cir
- 393 E Corral Creek Dr
- 397 E Tractor Dr Unit 103
- 8322 S Levine Ln Unit 111
- 8390 S 745 E
- 7956 S Farm House Ln
- 7579 S 520 E
- 7614 S 1000 E
- 744 E 8425 S
- 274 E Water Mill Way Unit 230
- 7824 S 280 E
- 770 Pinewood Cir
- 771 E Cedar Terrace Dr
- 771 Cedar Terrace Dr
- 780 Pinewood Cir
- 780 E Pinewood Cir
- 758 Pinewood Cir
- 758 E Pinewood Cir
- 7955 Pinewood Dr
- 7955 S Pinewood Dr
- 779 Cedar Terrace Dr
- 7942 Ponderosa Cir
- 781 Pinewood Cir
- 773 Pinewood Cir
- 7917 Pinewood Dr
- 7924 Ponderosa Cir
- 7952 Ponderosa Cir
- 7954 Pinewood Dr
- 785 Cedar Terrace Dr
- 785 E Cedar Terrace Dr
- 770 E Cedar Terrace Dr
Your Personal Tour Guide
Ask me questions while you tour the home.