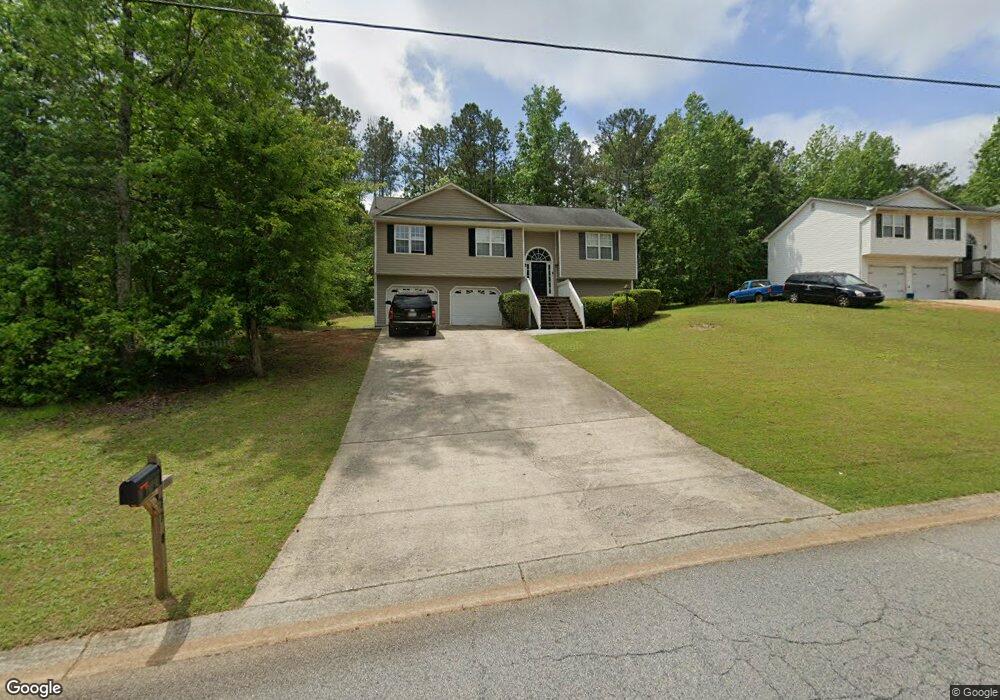
770 Eagles Nest Cir Carrollton, GA 30116
Estimated Value: $266,000 - $288,760
3
Beds
2
Baths
1,896
Sq Ft
$145/Sq Ft
Est. Value
About This Home
This home is located at 770 Eagles Nest Cir, Carrollton, GA 30116 and is currently estimated at $275,190, approximately $145 per square foot. 770 Eagles Nest Cir is a home located in Carroll County with nearby schools including Central Elementary School, Central Middle School, and Central High School.
Ownership History
Date
Name
Owned For
Owner Type
Purchase Details
Closed on
Jul 14, 2016
Bought by
Pintea Demi
Current Estimated Value
Purchase Details
Closed on
Jun 7, 2016
Bought by
Shockley Realty & Developmen
Purchase Details
Closed on
Jun 30, 2011
Sold by
Harris Walker Properties Llc
Bought by
Copley Sandra C
Home Financials for this Owner
Home Financials are based on the most recent Mortgage that was taken out on this home.
Original Mortgage
$72,922
Interest Rate
4.62%
Mortgage Type
FHA
Purchase Details
Closed on
Aug 5, 2010
Sold by
Bank Of North Georgia
Bought by
Harris Walker Properties Llc
Purchase Details
Closed on
Mar 2, 2010
Sold by
Geter Derrick M
Bought by
Bank Of North Georgia
Purchase Details
Closed on
Dec 18, 2003
Sold by
Mcdowell Dennis H
Bought by
Geter Derrick M and Geter Brandy W
Purchase Details
Closed on
Apr 28, 1999
Bought by
Mcdowell Dennis H
Create a Home Valuation Report for This Property
The Home Valuation Report is an in-depth analysis detailing your home's value as well as a comparison with similar homes in the area
Home Values in the Area
Average Home Value in this Area
Purchase History
| Date | Buyer | Sale Price | Title Company |
|---|---|---|---|
| Pintea Demi | $125,000 | -- | |
| Shockley Realty & Developmen | -- | -- | |
| Copley Sandra C | $76,000 | -- | |
| Harris Walker Properties Llc | $44,500 | -- | |
| Bank Of North Georgia | $59,320 | -- | |
| Geter Derrick M | $114,900 | -- | |
| Mcdowell Dennis H | -- | -- |
Source: Public Records
Mortgage History
| Date | Status | Borrower | Loan Amount |
|---|---|---|---|
| Previous Owner | Bank Of North Georgia | $72,922 |
Source: Public Records
Tax History Compared to Growth
Tax History
| Year | Tax Paid | Tax Assessment Tax Assessment Total Assessment is a certain percentage of the fair market value that is determined by local assessors to be the total taxable value of land and additions on the property. | Land | Improvement |
|---|---|---|---|---|
| 2024 | $2,199 | $97,200 | $5,483 | $91,717 |
| 2023 | $2,199 | $107,765 | $7,400 | $100,365 |
| 2022 | $2,173 | $86,650 | $6,000 | $80,650 |
| 2021 | $1,444 | $56,337 | $6,000 | $50,337 |
| 2020 | $1,446 | $56,337 | $6,000 | $50,337 |
| 2019 | $1,458 | $56,337 | $6,000 | $50,337 |
| 2018 | $1,133 | $43,141 | $4,000 | $39,141 |
| 2017 | $1,136 | $43,141 | $4,000 | $39,141 |
| 2016 | $1,137 | $43,141 | $4,000 | $39,141 |
| 2015 | $1,062 | $37,977 | $4,000 | $33,977 |
| 2014 | $923 | $32,881 | $4,000 | $28,881 |
Source: Public Records
Map
Nearby Homes
- 786 Eagles Nest Cir
- 746 Eagles Nest Cir
- 812 Eagles Nest Cir
- 1234 Eagles Nest Cir
- 722 Eagles Nest Cir
- 787 Eagles Nest Cir
- 1228 Eagles Nest Cir
- 1250 Eagles Nest Cir
- 101 Rulon Ct
- 1218 Eagles Nest Cir
- 813 Eagles Nest Cir
- 1266 Eagles Nest Cir
- 1266 Eagles Nest Cir
- 698 Eagles Nest Cir
- 609 Eagles Nest Cir
- 832 Eagles Nest Cir
- 0 Rulon Ct Unit 7501920
- 0 Rulon Ct Unit 8131781
- 0 Rulon Ct Unit 7397215
- 0 Rulon Ct