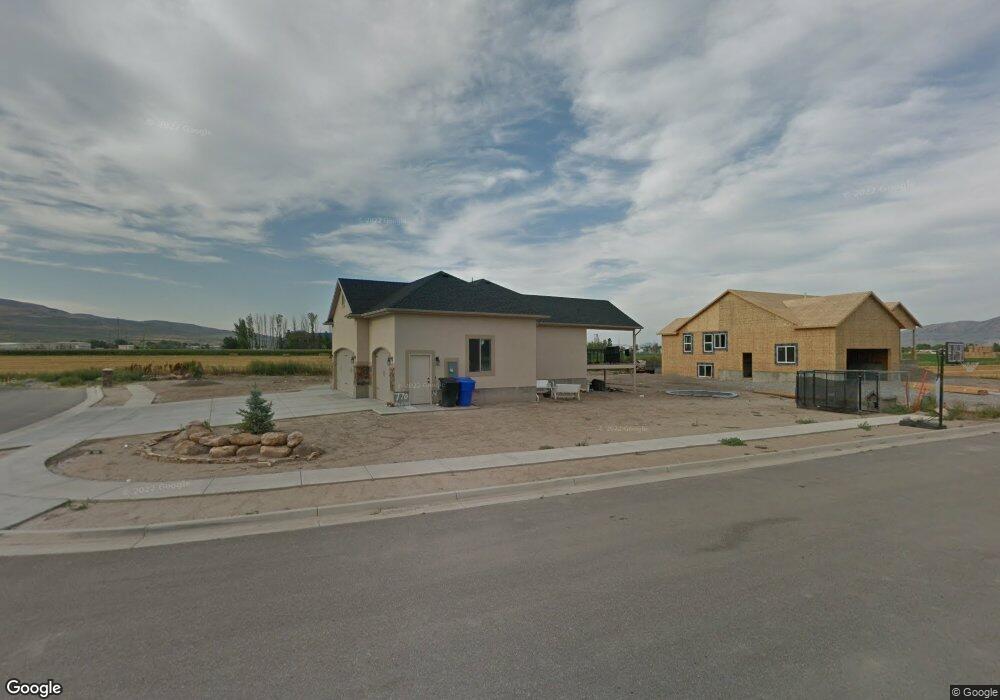
770 N 900 W Tremonton, UT 84337
Estimated Value: $527,000 - $662,000
6
Beds
4
Baths
3,308
Sq Ft
$176/Sq Ft
Est. Value
About This Home
This home is located at 770 N 900 W, Tremonton, UT 84337 and is currently estimated at $583,723, approximately $176 per square foot. 770 N 900 W is a home located in Box Elder County with nearby schools including North Park School, Alice C. Harris Intermediate School, and Bear River Middle School.
Ownership History
Date
Name
Owned For
Owner Type
Purchase Details
Closed on
Jan 6, 2020
Sold by
Summers Jason R and Summers Lisa M
Bought by
Oliver Mark and Oliver Carrie
Current Estimated Value
Home Financials for this Owner
Home Financials are based on the most recent Mortgage that was taken out on this home.
Original Mortgage
$296,800
Outstanding Balance
$262,235
Interest Rate
3.6%
Mortgage Type
VA
Estimated Equity
$321,488
Purchase Details
Closed on
Mar 26, 2018
Sold by
Summers Jason R
Bought by
Summers Jason R and Summers Lisa M
Home Financials for this Owner
Home Financials are based on the most recent Mortgage that was taken out on this home.
Original Mortgage
$251,627
Interest Rate
5.12%
Mortgage Type
FHA
Purchase Details
Closed on
Jun 29, 2012
Sold by
Woodward Jared J and Woodward Jessica M
Bought by
Summers Jason R and Summers Lisa M
Purchase Details
Closed on
Mar 29, 2007
Sold by
Rose Aluminium Inc
Bought by
Woodward Jared J and Woodward Jessica M
Create a Home Valuation Report for This Property
The Home Valuation Report is an in-depth analysis detailing your home's value as well as a comparison with similar homes in the area
Home Values in the Area
Average Home Value in this Area
Purchase History
| Date | Buyer | Sale Price | Title Company |
|---|---|---|---|
| Oliver Mark | -- | American Secure Ttl Tremonto | |
| Summers Jason R | -- | Us Title Insurance Agency | |
| Summers Jason R | -- | Us Title Insurance Agency | |
| Summers Jason R | -- | Elder Land Title Co | |
| Woodward Jared J | -- | None Available |
Source: Public Records
Mortgage History
| Date | Status | Borrower | Loan Amount |
|---|---|---|---|
| Open | Oliver Mark | $296,800 | |
| Previous Owner | Summers Jason R | $251,627 |
Source: Public Records
Tax History Compared to Growth
Tax History
| Year | Tax Paid | Tax Assessment Tax Assessment Total Assessment is a certain percentage of the fair market value that is determined by local assessors to be the total taxable value of land and additions on the property. | Land | Improvement |
|---|---|---|---|---|
| 2025 | $73 | $605,064 | $105,000 | $500,064 |
| 2024 | $74 | $1,113,462 | $105,000 | $1,008,462 |
| 2023 | $3,777 | $629,161 | $100,000 | $529,161 |
| 2022 | $3,458 | $328,368 | $19,250 | $309,118 |
| 2021 | $2,947 | $386,569 | $35,000 | $351,569 |
| 2020 | $2,556 | $386,569 | $35,000 | $351,569 |
| 2019 | $2,359 | $190,368 | $19,250 | $171,118 |
| 2018 | $2,303 | $172,765 | $19,250 | $153,515 |
| 2017 | $2,416 | $314,119 | $19,250 | $279,119 |
| 2016 | $2,369 | $165,455 | $19,250 | $146,205 |
| 2015 | $2,132 | $152,164 | $19,250 | $132,914 |
| 2014 | $2,132 | $145,832 | $19,250 | $126,582 |
| 2013 | -- | $144,492 | $18,677 | $125,815 |
Source: Public Records
Map
Nearby Homes
- 113 N 900 W
- 910 W 800 N
- Lyndhurst Plan at Archibald Estates - Tremonton (Active Adult Homes)
- Hawthorne Plan at Envision Estates - Tremonton
- Lyndhurst Plan at Envision Estates - Tremonton
- Aberdeen Plan at Envision Estates - Tremonton
- Magnolia Plan at Envision Estates - Tremonton
- Hemlock Plan at Envision Estates - Tremonton
- Glendale Plan at Envision Estates - Tremonton
- Hilldale Plan at Archibald Estates - Tremonton (Active Adult Homes)
- Blackberry Plan at Envision Estates - Tremonton
- Hayden Plan at Envision Estates - Tremonton
- Eucalyptus Plan at Envision Estates - Tremonton
- 768 N 600 W Unit 211
- 256 N 870 E Unit 18
- 234 N 870 E Unit 19
- 702 N 600 W Unit 106
- 696 N 600 W Unit 105
- 688 N 600 W Unit 104
- 678 N 600 W Unit 103